Tohono O'odham vs Soviet Union Disability Age 18 to 34
COMPARE
Tohono O'odham
Soviet Union
Disability Age 18 to 34
Disability Age 18 to 34 Comparison
Tohono O'odham
Soviet Union
7.3%
DISABILITY AGE 18 TO 34
0.2/ 100
METRIC RATING
260th/ 347
METRIC RANK
5.7%
DISABILITY AGE 18 TO 34
99.9/ 100
METRIC RATING
28th/ 347
METRIC RANK
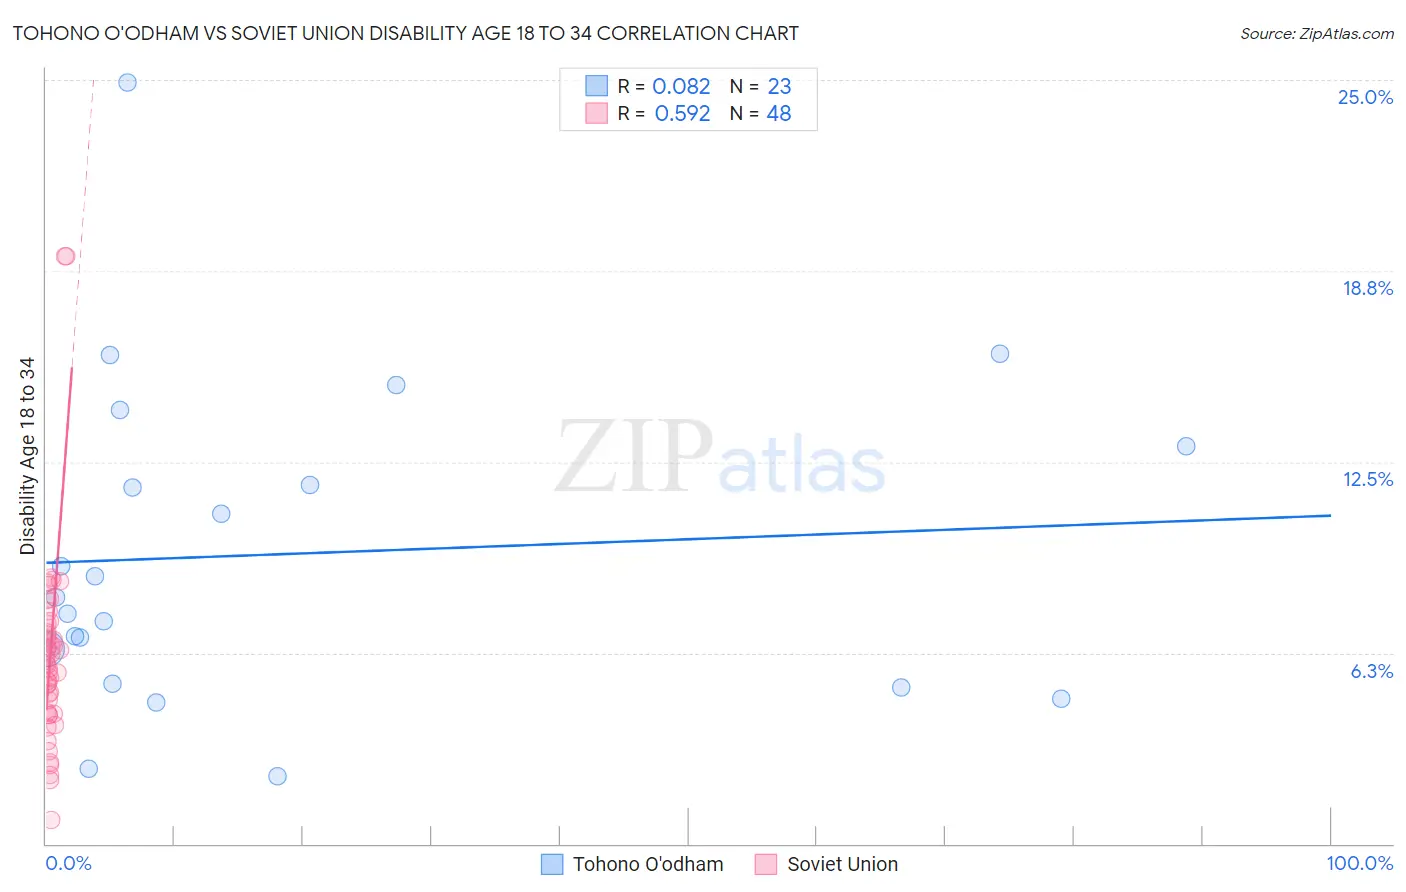
Tohono O'odham vs Soviet Union Disability Age 18 to 34 Correlation Chart
The statistical analysis conducted on geographies consisting of 58,690,000 people shows a slight positive correlation between the proportion of Tohono O'odham and percentage of population with a disability between the ages 18 and 35 in the United States with a correlation coefficient (R) of 0.082 and weighted average of 7.3%. Similarly, the statistical analysis conducted on geographies consisting of 43,478,367 people shows a substantial positive correlation between the proportion of Soviet Union and percentage of population with a disability between the ages 18 and 35 in the United States with a correlation coefficient (R) of 0.592 and weighted average of 5.7%, a difference of 27.1%.
Disability Age 18 to 34 Correlation Summary
| Measurement | Tohono O'odham | Soviet Union |
| Minimum | 2.2% | 0.77% |
| Maximum | 24.9% | 19.2% |
| Range | 22.7% | 18.5% |
| Mean | 9.5% | 6.2% |
| Median | 8.1% | 5.9% |
| Interquartile 25% (IQ1) | 5.2% | 4.3% |
| Interquartile 75% (IQ3) | 13.0% | 7.0% |
| Interquartile Range (IQR) | 7.8% | 2.8% |
| Standard Deviation (Sample) | 5.3% | 3.3% |
| Standard Deviation (Population) | 5.2% | 3.3% |
Similar Demographics by Disability Age 18 to 34
Demographics Similar to Tohono O'odham by Disability Age 18 to 34
In terms of disability age 18 to 34, the demographic groups most similar to Tohono O'odham are Somali (7.3%, a difference of 0.060%), Immigrants from Micronesia (7.3%, a difference of 0.12%), Northern European (7.3%, a difference of 0.17%), Canadian (7.3%, a difference of 0.20%), and British (7.3%, a difference of 0.49%).
| Demographics | Rating | Rank | Disability Age 18 to 34 |
| Croatians | 0.5 /100 | #253 | Tragic 7.2% |
| Indonesians | 0.4 /100 | #254 | Tragic 7.2% |
| Immigrants | Germany | 0.4 /100 | #255 | Tragic 7.2% |
| Immigrants | Laos | 0.4 /100 | #256 | Tragic 7.2% |
| Czechs | 0.3 /100 | #257 | Tragic 7.2% |
| Immigrants | Micronesia | 0.3 /100 | #258 | Tragic 7.3% |
| Somalis | 0.2 /100 | #259 | Tragic 7.3% |
| Tohono O'odham | 0.2 /100 | #260 | Tragic 7.3% |
| Northern Europeans | 0.2 /100 | #261 | Tragic 7.3% |
| Canadians | 0.2 /100 | #262 | Tragic 7.3% |
| British | 0.2 /100 | #263 | Tragic 7.3% |
| Bermudans | 0.1 /100 | #264 | Tragic 7.3% |
| Slovenes | 0.1 /100 | #265 | Tragic 7.3% |
| German Russians | 0.1 /100 | #266 | Tragic 7.4% |
| Bangladeshis | 0.1 /100 | #267 | Tragic 7.4% |
Demographics Similar to Soviet Union by Disability Age 18 to 34
In terms of disability age 18 to 34, the demographic groups most similar to Soviet Union are Immigrants from Venezuela (5.7%, a difference of 0.090%), Immigrants from Ecuador (5.7%, a difference of 0.090%), Immigrants from Colombia (5.7%, a difference of 0.20%), Immigrants from Pakistan (5.8%, a difference of 0.29%), and Immigrants from Singapore (5.7%, a difference of 0.35%).
| Demographics | Rating | Rank | Disability Age 18 to 34 |
| Immigrants | South Central Asia | 100.0 /100 | #21 | Exceptional 5.7% |
| Immigrants | Nicaragua | 100.0 /100 | #22 | Exceptional 5.7% |
| Cubans | 100.0 /100 | #23 | Exceptional 5.7% |
| Immigrants | Argentina | 100.0 /100 | #24 | Exceptional 5.7% |
| Immigrants | Singapore | 100.0 /100 | #25 | Exceptional 5.7% |
| Immigrants | Colombia | 100.0 /100 | #26 | Exceptional 5.7% |
| Immigrants | Venezuela | 99.9 /100 | #27 | Exceptional 5.7% |
| Soviet Union | 99.9 /100 | #28 | Exceptional 5.7% |
| Immigrants | Ecuador | 99.9 /100 | #29 | Exceptional 5.7% |
| Immigrants | Pakistan | 99.9 /100 | #30 | Exceptional 5.8% |
| Iranians | 99.9 /100 | #31 | Exceptional 5.8% |
| Immigrants | Barbados | 99.9 /100 | #32 | Exceptional 5.8% |
| Argentineans | 99.9 /100 | #33 | Exceptional 5.8% |
| Venezuelans | 99.9 /100 | #34 | Exceptional 5.8% |
| Immigrants | Lithuania | 99.9 /100 | #35 | Exceptional 5.8% |