Inupiat vs Romanian Disability Age 18 to 34
COMPARE
Inupiat
Romanian
Disability Age 18 to 34
Disability Age 18 to 34 Comparison
Inupiat
Romanians
6.5%
DISABILITY AGE 18 TO 34
76.7/ 100
METRIC RATING
155th/ 347
METRIC RANK
6.6%
DISABILITY AGE 18 TO 34
39.5/ 100
METRIC RATING
181st/ 347
METRIC RANK
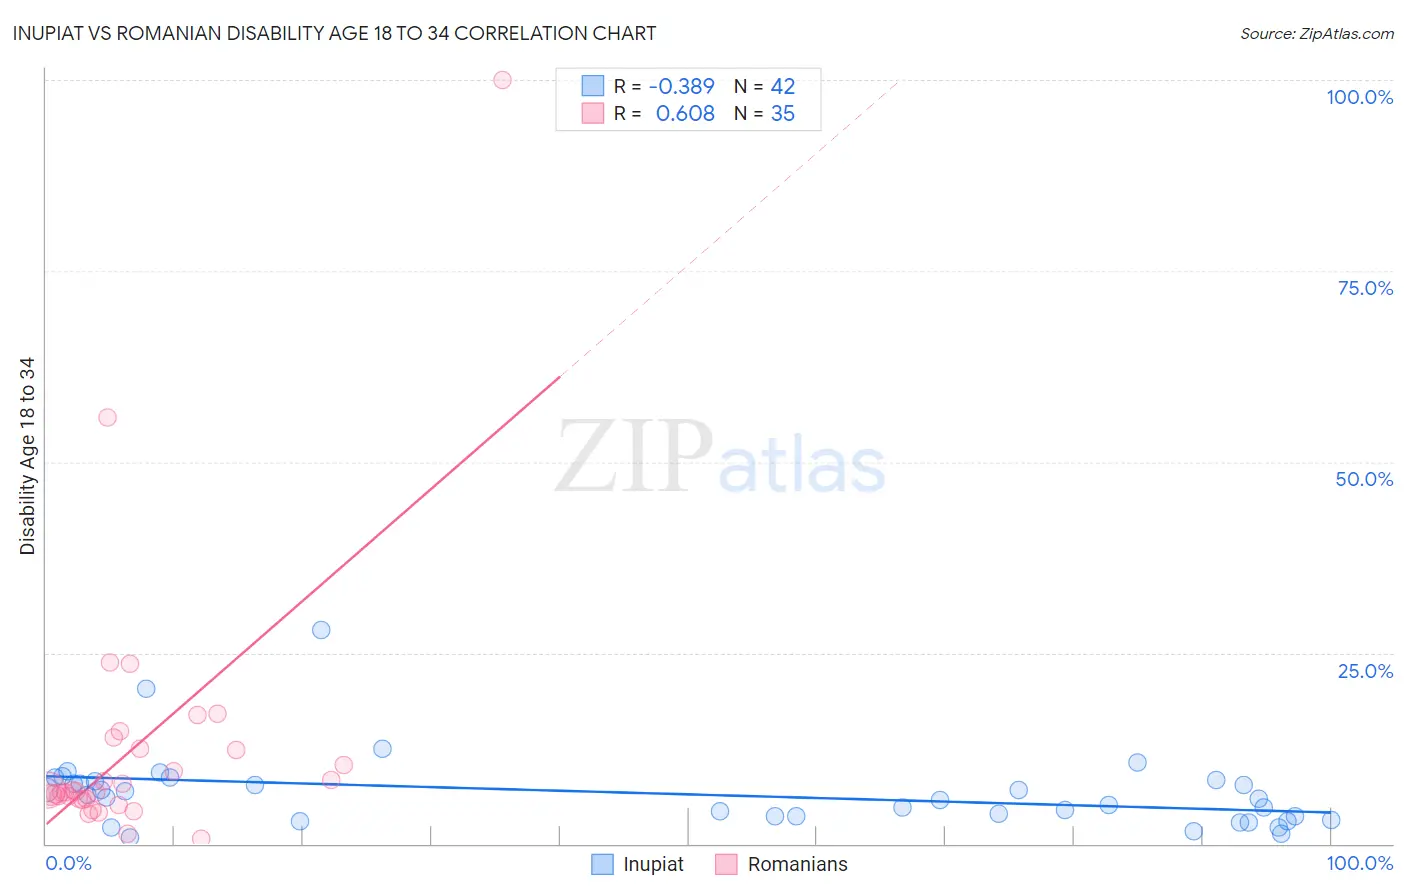
Inupiat vs Romanian Disability Age 18 to 34 Correlation Chart
The statistical analysis conducted on geographies consisting of 96,272,829 people shows a mild negative correlation between the proportion of Inupiat and percentage of population with a disability between the ages 18 and 35 in the United States with a correlation coefficient (R) of -0.389 and weighted average of 6.5%. Similarly, the statistical analysis conducted on geographies consisting of 376,995,004 people shows a significant positive correlation between the proportion of Romanians and percentage of population with a disability between the ages 18 and 35 in the United States with a correlation coefficient (R) of 0.608 and weighted average of 6.6%, a difference of 2.9%.
Disability Age 18 to 34 Correlation Summary
| Measurement | Inupiat | Romanian |
| Minimum | 0.88% | 0.58% |
| Maximum | 28.1% | 100.0% |
| Range | 27.2% | 99.4% |
| Mean | 6.6% | 12.6% |
| Median | 6.0% | 7.0% |
| Interquartile 25% (IQ1) | 3.6% | 5.8% |
| Interquartile 75% (IQ3) | 8.2% | 12.5% |
| Interquartile Range (IQR) | 4.6% | 6.7% |
| Standard Deviation (Sample) | 4.9% | 18.0% |
| Standard Deviation (Population) | 4.8% | 17.7% |
Similar Demographics by Disability Age 18 to 34
Demographics Similar to Inupiat by Disability Age 18 to 34
In terms of disability age 18 to 34, the demographic groups most similar to Inupiat are Immigrants from Central America (6.5%, a difference of 0.0%), Immigrants from Eritrea (6.5%, a difference of 0.070%), Immigrants from Panama (6.5%, a difference of 0.13%), Bulgarian (6.5%, a difference of 0.16%), and Immigrants from Sierra Leone (6.5%, a difference of 0.17%).
| Demographics | Rating | Rank | Disability Age 18 to 34 |
| Immigrants | Belgium | 83.5 /100 | #148 | Excellent 6.4% |
| Hondurans | 83.1 /100 | #149 | Excellent 6.4% |
| Immigrants | Dominican Republic | 82.7 /100 | #150 | Excellent 6.4% |
| Tongans | 81.9 /100 | #151 | Excellent 6.4% |
| Bulgarians | 78.3 /100 | #152 | Good 6.5% |
| Immigrants | Eritrea | 77.4 /100 | #153 | Good 6.5% |
| Immigrants | Central America | 76.8 /100 | #154 | Good 6.5% |
| Inupiat | 76.7 /100 | #155 | Good 6.5% |
| Immigrants | Panama | 75.3 /100 | #156 | Good 6.5% |
| Immigrants | Sierra Leone | 75.0 /100 | #157 | Good 6.5% |
| Zimbabweans | 74.7 /100 | #158 | Good 6.5% |
| Dominicans | 73.6 /100 | #159 | Good 6.5% |
| Immigrants | Southern Europe | 72.5 /100 | #160 | Good 6.5% |
| Arabs | 72.3 /100 | #161 | Good 6.5% |
| South Africans | 71.7 /100 | #162 | Good 6.5% |
Demographics Similar to Romanians by Disability Age 18 to 34
In terms of disability age 18 to 34, the demographic groups most similar to Romanians are Immigrants from Austria (6.6%, a difference of 0.010%), U.S. Virgin Islander (6.7%, a difference of 0.060%), Immigrants from Iraq (6.7%, a difference of 0.15%), Iraqi (6.7%, a difference of 0.16%), and Immigrants from Ghana (6.6%, a difference of 0.19%).
| Demographics | Rating | Rank | Disability Age 18 to 34 |
| Native Hawaiians | 50.0 /100 | #174 | Average 6.6% |
| Immigrants | Cambodia | 46.5 /100 | #175 | Average 6.6% |
| Immigrants | Africa | 45.9 /100 | #176 | Average 6.6% |
| Syrians | 44.3 /100 | #177 | Average 6.6% |
| Nigerians | 43.7 /100 | #178 | Average 6.6% |
| Immigrants | Ghana | 42.1 /100 | #179 | Average 6.6% |
| Immigrants | Austria | 39.6 /100 | #180 | Fair 6.6% |
| Romanians | 39.5 /100 | #181 | Fair 6.6% |
| U.S. Virgin Islanders | 38.6 /100 | #182 | Fair 6.7% |
| Immigrants | Iraq | 37.4 /100 | #183 | Fair 6.7% |
| Iraqis | 37.4 /100 | #184 | Fair 6.7% |
| Immigrants | Oceania | 35.4 /100 | #185 | Fair 6.7% |
| Yup'ik | 35.3 /100 | #186 | Fair 6.7% |
| Maltese | 34.8 /100 | #187 | Fair 6.7% |
| Immigrants | Cameroon | 34.5 /100 | #188 | Fair 6.7% |