Immigrants from Eastern Asia vs Romanian Disability Age 18 to 34
COMPARE
Immigrants from Eastern Asia
Romanian
Disability Age 18 to 34
Disability Age 18 to 34 Comparison
Immigrants from Eastern Asia
Romanians
5.6%
DISABILITY AGE 18 TO 34
100.0/ 100
METRIC RATING
17th/ 347
METRIC RANK
6.6%
DISABILITY AGE 18 TO 34
39.5/ 100
METRIC RATING
181st/ 347
METRIC RANK
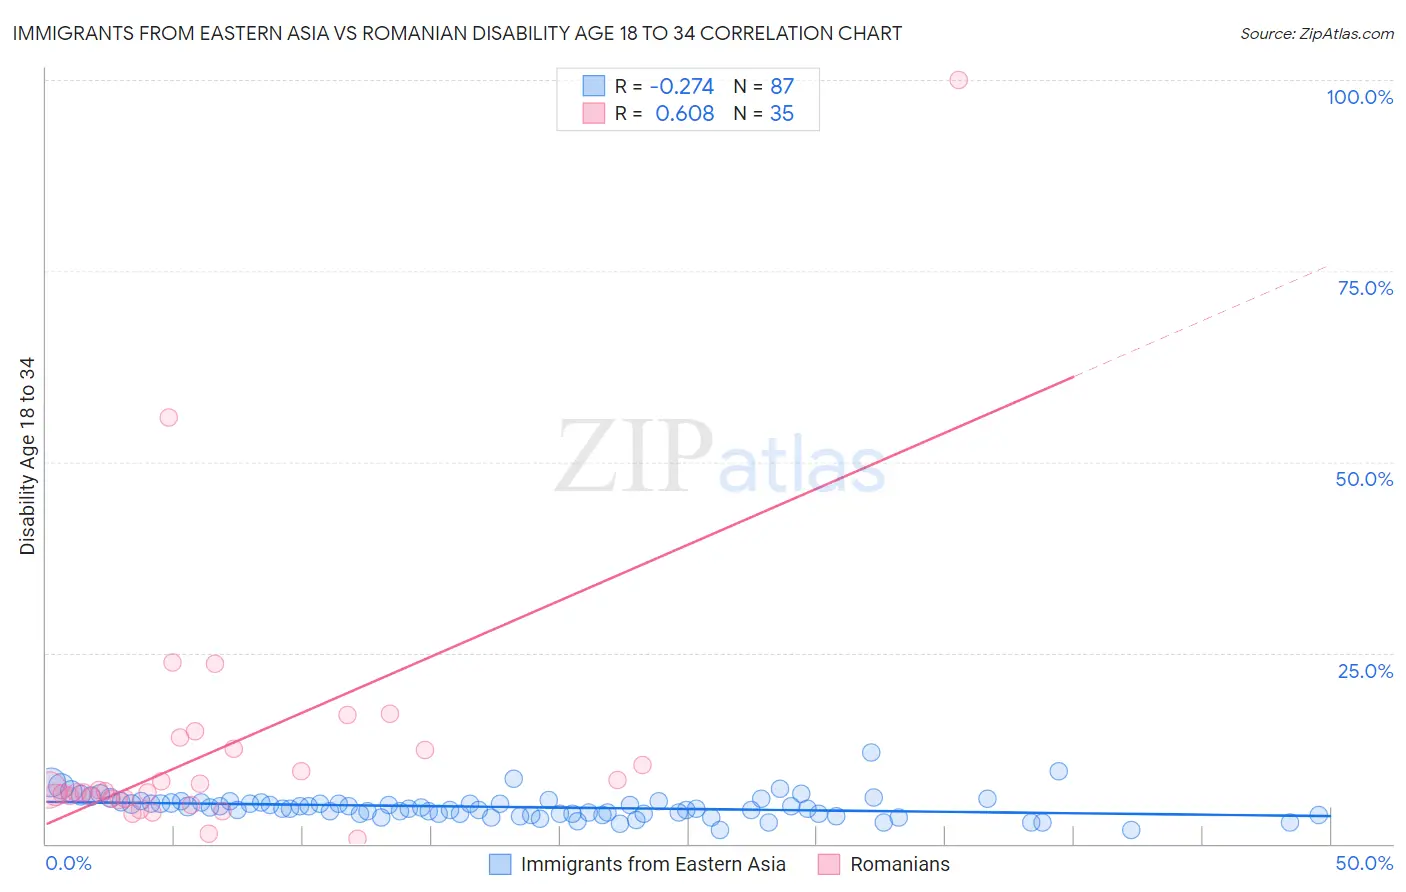
Immigrants from Eastern Asia vs Romanian Disability Age 18 to 34 Correlation Chart
The statistical analysis conducted on geographies consisting of 498,053,268 people shows a weak negative correlation between the proportion of Immigrants from Eastern Asia and percentage of population with a disability between the ages 18 and 35 in the United States with a correlation coefficient (R) of -0.274 and weighted average of 5.6%. Similarly, the statistical analysis conducted on geographies consisting of 376,995,004 people shows a significant positive correlation between the proportion of Romanians and percentage of population with a disability between the ages 18 and 35 in the United States with a correlation coefficient (R) of 0.608 and weighted average of 6.6%, a difference of 19.1%.
Disability Age 18 to 34 Correlation Summary
| Measurement | Immigrants from Eastern Asia | Romanian |
| Minimum | 1.8% | 0.58% |
| Maximum | 12.0% | 100.0% |
| Range | 10.2% | 99.4% |
| Mean | 4.8% | 12.6% |
| Median | 4.6% | 7.0% |
| Interquartile 25% (IQ1) | 3.9% | 5.8% |
| Interquartile 75% (IQ3) | 5.5% | 12.5% |
| Interquartile Range (IQR) | 1.6% | 6.7% |
| Standard Deviation (Sample) | 1.6% | 18.0% |
| Standard Deviation (Population) | 1.6% | 17.7% |
Similar Demographics by Disability Age 18 to 34
Demographics Similar to Immigrants from Eastern Asia by Disability Age 18 to 34
In terms of disability age 18 to 34, the demographic groups most similar to Immigrants from Eastern Asia are Immigrants from Israel (5.6%, a difference of 0.17%), Immigrants from India (5.6%, a difference of 0.20%), Indian (Asian) (5.5%, a difference of 0.58%), Immigrants from Iran (5.5%, a difference of 0.73%), and Immigrants from Bolivia (5.6%, a difference of 0.76%).
| Demographics | Rating | Rank | Disability Age 18 to 34 |
| Immigrants | Uzbekistan | 100.0 /100 | #10 | Exceptional 5.5% |
| Vietnamese | 100.0 /100 | #11 | Exceptional 5.5% |
| Immigrants | St. Vincent and the Grenadines | 100.0 /100 | #12 | Exceptional 5.5% |
| Immigrants | Iran | 100.0 /100 | #13 | Exceptional 5.5% |
| Indians (Asian) | 100.0 /100 | #14 | Exceptional 5.5% |
| Immigrants | India | 100.0 /100 | #15 | Exceptional 5.6% |
| Immigrants | Israel | 100.0 /100 | #16 | Exceptional 5.6% |
| Immigrants | Eastern Asia | 100.0 /100 | #17 | Exceptional 5.6% |
| Immigrants | Bolivia | 100.0 /100 | #18 | Exceptional 5.6% |
| Thais | 100.0 /100 | #19 | Exceptional 5.6% |
| Immigrants | Bangladesh | 100.0 /100 | #20 | Exceptional 5.6% |
| Immigrants | South Central Asia | 100.0 /100 | #21 | Exceptional 5.7% |
| Immigrants | Nicaragua | 100.0 /100 | #22 | Exceptional 5.7% |
| Cubans | 100.0 /100 | #23 | Exceptional 5.7% |
| Immigrants | Argentina | 100.0 /100 | #24 | Exceptional 5.7% |
Demographics Similar to Romanians by Disability Age 18 to 34
In terms of disability age 18 to 34, the demographic groups most similar to Romanians are Immigrants from Austria (6.6%, a difference of 0.010%), U.S. Virgin Islander (6.7%, a difference of 0.060%), Immigrants from Iraq (6.7%, a difference of 0.15%), Iraqi (6.7%, a difference of 0.16%), and Immigrants from Ghana (6.6%, a difference of 0.19%).
| Demographics | Rating | Rank | Disability Age 18 to 34 |
| Native Hawaiians | 50.0 /100 | #174 | Average 6.6% |
| Immigrants | Cambodia | 46.5 /100 | #175 | Average 6.6% |
| Immigrants | Africa | 45.9 /100 | #176 | Average 6.6% |
| Syrians | 44.3 /100 | #177 | Average 6.6% |
| Nigerians | 43.7 /100 | #178 | Average 6.6% |
| Immigrants | Ghana | 42.1 /100 | #179 | Average 6.6% |
| Immigrants | Austria | 39.6 /100 | #180 | Fair 6.6% |
| Romanians | 39.5 /100 | #181 | Fair 6.6% |
| U.S. Virgin Islanders | 38.6 /100 | #182 | Fair 6.7% |
| Immigrants | Iraq | 37.4 /100 | #183 | Fair 6.7% |
| Iraqis | 37.4 /100 | #184 | Fair 6.7% |
| Immigrants | Oceania | 35.4 /100 | #185 | Fair 6.7% |
| Yup'ik | 35.3 /100 | #186 | Fair 6.7% |
| Maltese | 34.8 /100 | #187 | Fair 6.7% |
| Immigrants | Cameroon | 34.5 /100 | #188 | Fair 6.7% |