Tohono O'odham vs French American Indian Disability Age 18 to 34
COMPARE
Tohono O'odham
French American Indian
Disability Age 18 to 34
Disability Age 18 to 34 Comparison
Tohono O'odham
French American Indians
7.3%
DISABILITY AGE 18 TO 34
0.2/ 100
METRIC RATING
260th/ 347
METRIC RANK
8.2%
DISABILITY AGE 18 TO 34
0.0/ 100
METRIC RATING
323rd/ 347
METRIC RANK
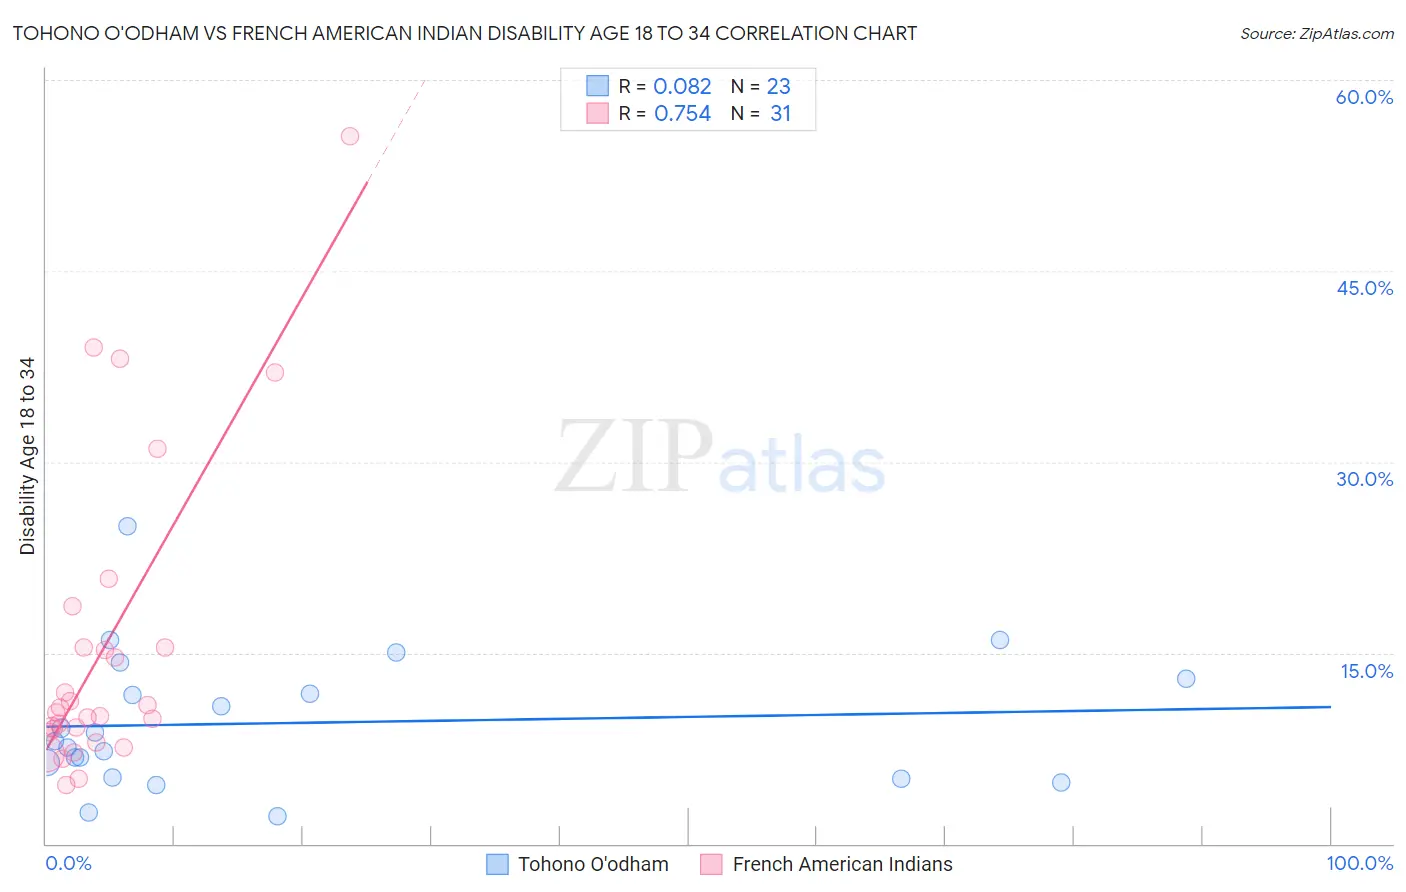
Tohono O'odham vs French American Indian Disability Age 18 to 34 Correlation Chart
The statistical analysis conducted on geographies consisting of 58,690,000 people shows a slight positive correlation between the proportion of Tohono O'odham and percentage of population with a disability between the ages 18 and 35 in the United States with a correlation coefficient (R) of 0.082 and weighted average of 7.3%. Similarly, the statistical analysis conducted on geographies consisting of 131,872,586 people shows a strong positive correlation between the proportion of French American Indians and percentage of population with a disability between the ages 18 and 35 in the United States with a correlation coefficient (R) of 0.754 and weighted average of 8.2%, a difference of 12.0%.
Disability Age 18 to 34 Correlation Summary
| Measurement | Tohono O'odham | French American Indian |
| Minimum | 2.2% | 4.6% |
| Maximum | 24.9% | 55.6% |
| Range | 22.7% | 50.9% |
| Mean | 9.5% | 15.4% |
| Median | 8.1% | 10.3% |
| Interquartile 25% (IQ1) | 5.2% | 8.8% |
| Interquartile 75% (IQ3) | 13.0% | 15.4% |
| Interquartile Range (IQR) | 7.8% | 6.6% |
| Standard Deviation (Sample) | 5.3% | 12.1% |
| Standard Deviation (Population) | 5.2% | 11.9% |
Similar Demographics by Disability Age 18 to 34
Demographics Similar to Tohono O'odham by Disability Age 18 to 34
In terms of disability age 18 to 34, the demographic groups most similar to Tohono O'odham are Somali (7.3%, a difference of 0.060%), Immigrants from Micronesia (7.3%, a difference of 0.12%), Northern European (7.3%, a difference of 0.17%), Canadian (7.3%, a difference of 0.20%), and British (7.3%, a difference of 0.49%).
| Demographics | Rating | Rank | Disability Age 18 to 34 |
| Croatians | 0.5 /100 | #253 | Tragic 7.2% |
| Indonesians | 0.4 /100 | #254 | Tragic 7.2% |
| Immigrants | Germany | 0.4 /100 | #255 | Tragic 7.2% |
| Immigrants | Laos | 0.4 /100 | #256 | Tragic 7.2% |
| Czechs | 0.3 /100 | #257 | Tragic 7.2% |
| Immigrants | Micronesia | 0.3 /100 | #258 | Tragic 7.3% |
| Somalis | 0.2 /100 | #259 | Tragic 7.3% |
| Tohono O'odham | 0.2 /100 | #260 | Tragic 7.3% |
| Northern Europeans | 0.2 /100 | #261 | Tragic 7.3% |
| Canadians | 0.2 /100 | #262 | Tragic 7.3% |
| British | 0.2 /100 | #263 | Tragic 7.3% |
| Bermudans | 0.1 /100 | #264 | Tragic 7.3% |
| Slovenes | 0.1 /100 | #265 | Tragic 7.3% |
| German Russians | 0.1 /100 | #266 | Tragic 7.4% |
| Bangladeshis | 0.1 /100 | #267 | Tragic 7.4% |
Demographics Similar to French American Indians by Disability Age 18 to 34
In terms of disability age 18 to 34, the demographic groups most similar to French American Indians are Cajun (8.2%, a difference of 0.040%), Cree (8.1%, a difference of 0.51%), Native/Alaskan (8.2%, a difference of 0.56%), Blackfeet (8.1%, a difference of 0.57%), and Potawatomi (8.2%, a difference of 0.58%).
| Demographics | Rating | Rank | Disability Age 18 to 34 |
| Puerto Ricans | 0.0 /100 | #316 | Tragic 8.0% |
| Hmong | 0.0 /100 | #317 | Tragic 8.1% |
| French Canadians | 0.0 /100 | #318 | Tragic 8.1% |
| Aleuts | 0.0 /100 | #319 | Tragic 8.1% |
| Navajo | 0.0 /100 | #320 | Tragic 8.1% |
| Blackfeet | 0.0 /100 | #321 | Tragic 8.1% |
| Cree | 0.0 /100 | #322 | Tragic 8.1% |
| French American Indians | 0.0 /100 | #323 | Tragic 8.2% |
| Cajuns | 0.0 /100 | #324 | Tragic 8.2% |
| Natives/Alaskans | 0.0 /100 | #325 | Tragic 8.2% |
| Potawatomi | 0.0 /100 | #326 | Tragic 8.2% |
| Sioux | 0.0 /100 | #327 | Tragic 8.2% |
| Delaware | 0.0 /100 | #328 | Tragic 8.2% |
| Crow | 0.0 /100 | #329 | Tragic 8.3% |
| Osage | 0.0 /100 | #330 | Tragic 8.3% |