Immigrants from Haiti vs Romanian Disability Age 18 to 34
COMPARE
Immigrants from Haiti
Romanian
Disability Age 18 to 34
Disability Age 18 to 34 Comparison
Immigrants from Haiti
Romanians
5.9%
DISABILITY AGE 18 TO 34
99.7/ 100
METRIC RATING
57th/ 347
METRIC RANK
6.6%
DISABILITY AGE 18 TO 34
39.5/ 100
METRIC RATING
181st/ 347
METRIC RANK
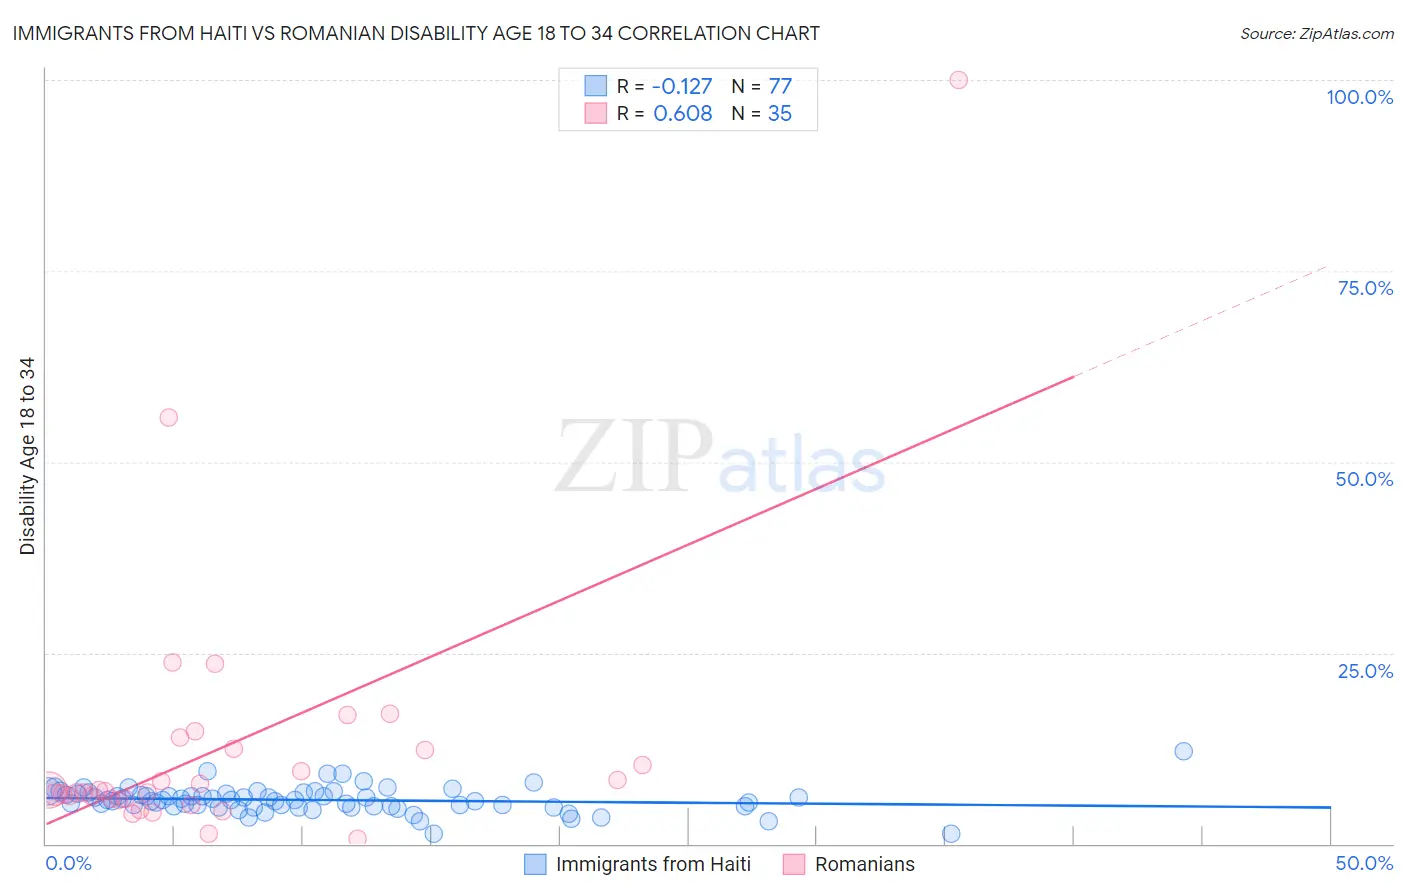
Immigrants from Haiti vs Romanian Disability Age 18 to 34 Correlation Chart
The statistical analysis conducted on geographies consisting of 225,012,435 people shows a poor negative correlation between the proportion of Immigrants from Haiti and percentage of population with a disability between the ages 18 and 35 in the United States with a correlation coefficient (R) of -0.127 and weighted average of 5.9%. Similarly, the statistical analysis conducted on geographies consisting of 376,995,004 people shows a significant positive correlation between the proportion of Romanians and percentage of population with a disability between the ages 18 and 35 in the United States with a correlation coefficient (R) of 0.608 and weighted average of 6.6%, a difference of 11.8%.
Disability Age 18 to 34 Correlation Summary
| Measurement | Immigrants from Haiti | Romanian |
| Minimum | 1.4% | 0.58% |
| Maximum | 12.1% | 100.0% |
| Range | 10.8% | 99.4% |
| Mean | 5.7% | 12.6% |
| Median | 5.7% | 7.0% |
| Interquartile 25% (IQ1) | 4.9% | 5.8% |
| Interquartile 75% (IQ3) | 6.6% | 12.5% |
| Interquartile Range (IQR) | 1.7% | 6.7% |
| Standard Deviation (Sample) | 1.7% | 18.0% |
| Standard Deviation (Population) | 1.7% | 17.7% |
Similar Demographics by Disability Age 18 to 34
Demographics Similar to Immigrants from Haiti by Disability Age 18 to 34
In terms of disability age 18 to 34, the demographic groups most similar to Immigrants from Haiti are Immigrants from Serbia (5.9%, a difference of 0.020%), Paraguayan (5.9%, a difference of 0.11%), Immigrants from Caribbean (6.0%, a difference of 0.16%), Immigrants from Sri Lanka (6.0%, a difference of 0.16%), and Immigrants from Spain (5.9%, a difference of 0.27%).
| Demographics | Rating | Rank | Disability Age 18 to 34 |
| Immigrants | El Salvador | 99.8 /100 | #50 | Exceptional 5.9% |
| Egyptians | 99.8 /100 | #51 | Exceptional 5.9% |
| Okinawans | 99.7 /100 | #52 | Exceptional 5.9% |
| Immigrants | Indonesia | 99.7 /100 | #53 | Exceptional 5.9% |
| Immigrants | Malaysia | 99.7 /100 | #54 | Exceptional 5.9% |
| Immigrants | Spain | 99.7 /100 | #55 | Exceptional 5.9% |
| Paraguayans | 99.7 /100 | #56 | Exceptional 5.9% |
| Immigrants | Haiti | 99.7 /100 | #57 | Exceptional 5.9% |
| Immigrants | Serbia | 99.7 /100 | #58 | Exceptional 5.9% |
| Immigrants | Caribbean | 99.6 /100 | #59 | Exceptional 6.0% |
| Immigrants | Sri Lanka | 99.6 /100 | #60 | Exceptional 6.0% |
| British West Indians | 99.6 /100 | #61 | Exceptional 6.0% |
| Peruvians | 99.6 /100 | #62 | Exceptional 6.0% |
| Salvadorans | 99.6 /100 | #63 | Exceptional 6.0% |
| Taiwanese | 99.6 /100 | #64 | Exceptional 6.0% |
Demographics Similar to Romanians by Disability Age 18 to 34
In terms of disability age 18 to 34, the demographic groups most similar to Romanians are Immigrants from Austria (6.6%, a difference of 0.010%), U.S. Virgin Islander (6.7%, a difference of 0.060%), Immigrants from Iraq (6.7%, a difference of 0.15%), Iraqi (6.7%, a difference of 0.16%), and Immigrants from Ghana (6.6%, a difference of 0.19%).
| Demographics | Rating | Rank | Disability Age 18 to 34 |
| Native Hawaiians | 50.0 /100 | #174 | Average 6.6% |
| Immigrants | Cambodia | 46.5 /100 | #175 | Average 6.6% |
| Immigrants | Africa | 45.9 /100 | #176 | Average 6.6% |
| Syrians | 44.3 /100 | #177 | Average 6.6% |
| Nigerians | 43.7 /100 | #178 | Average 6.6% |
| Immigrants | Ghana | 42.1 /100 | #179 | Average 6.6% |
| Immigrants | Austria | 39.6 /100 | #180 | Fair 6.6% |
| Romanians | 39.5 /100 | #181 | Fair 6.6% |
| U.S. Virgin Islanders | 38.6 /100 | #182 | Fair 6.7% |
| Immigrants | Iraq | 37.4 /100 | #183 | Fair 6.7% |
| Iraqis | 37.4 /100 | #184 | Fair 6.7% |
| Immigrants | Oceania | 35.4 /100 | #185 | Fair 6.7% |
| Yup'ik | 35.3 /100 | #186 | Fair 6.7% |
| Maltese | 34.8 /100 | #187 | Fair 6.7% |
| Immigrants | Cameroon | 34.5 /100 | #188 | Fair 6.7% |