Thai vs Immigrants from England Cognitive Disability
COMPARE
Thai
Immigrants from England
Cognitive Disability
Cognitive Disability Comparison
Thais
Immigrants from England
16.1%
COGNITIVE DISABILITY
100.0/ 100
METRIC RATING
6th/ 347
METRIC RANK
16.6%
COGNITIVE DISABILITY
99.6/ 100
METRIC RATING
61st/ 347
METRIC RANK
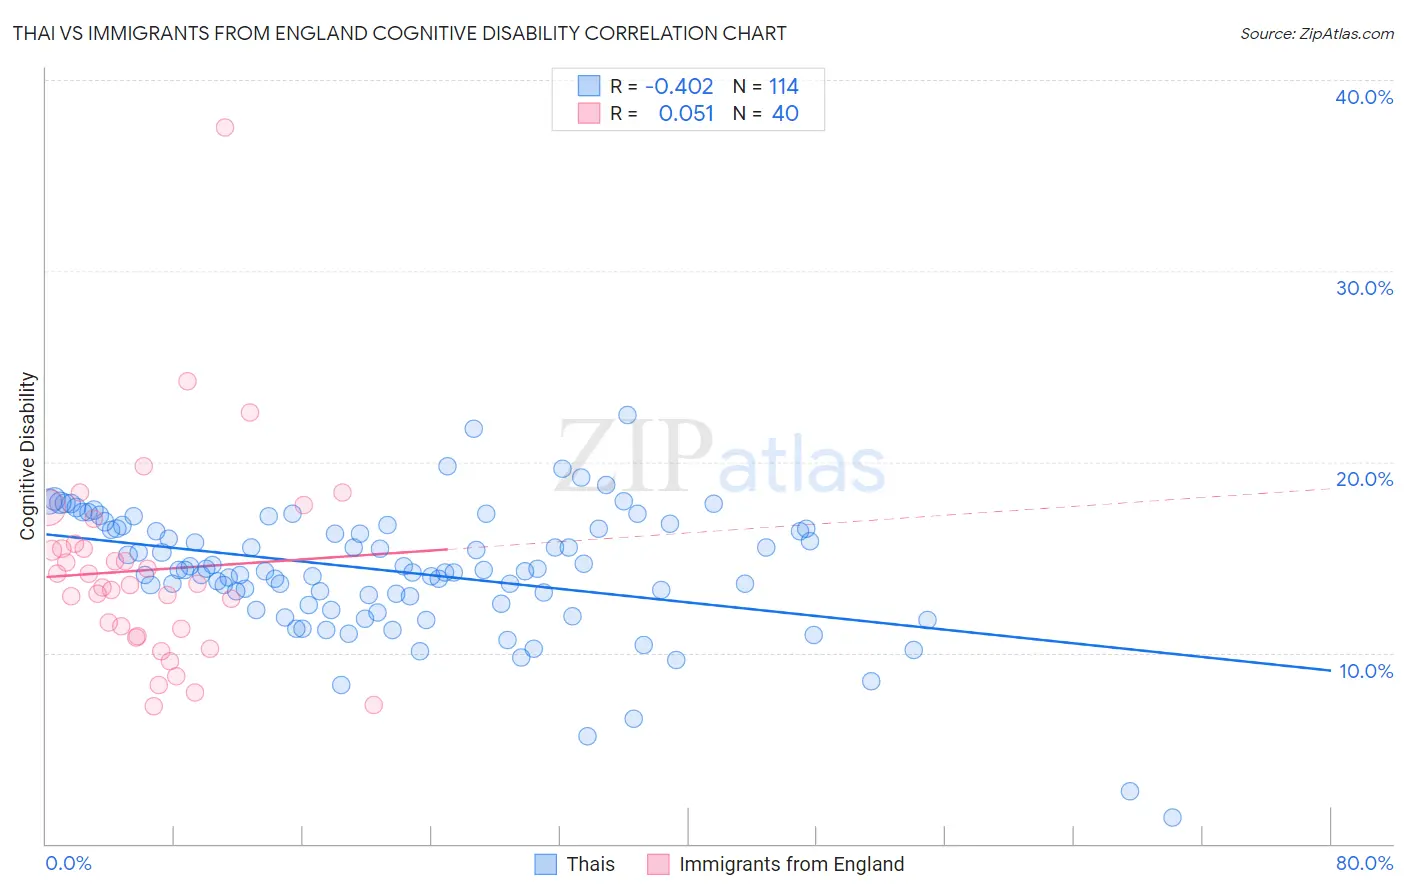
Thai vs Immigrants from England Cognitive Disability Correlation Chart
The statistical analysis conducted on geographies consisting of 475,822,165 people shows a moderate negative correlation between the proportion of Thais and percentage of population with cognitive disability in the United States with a correlation coefficient (R) of -0.402 and weighted average of 16.1%. Similarly, the statistical analysis conducted on geographies consisting of 391,893,945 people shows a slight positive correlation between the proportion of Immigrants from England and percentage of population with cognitive disability in the United States with a correlation coefficient (R) of 0.051 and weighted average of 16.6%, a difference of 2.9%.
Cognitive Disability Correlation Summary
| Measurement | Thai | Immigrants from England |
| Minimum | 1.4% | 7.2% |
| Maximum | 22.4% | 37.5% |
| Range | 21.1% | 30.3% |
| Mean | 14.3% | 14.3% |
| Median | 14.3% | 13.6% |
| Interquartile 25% (IQ1) | 12.6% | 11.1% |
| Interquartile 75% (IQ3) | 16.5% | 15.6% |
| Interquartile Range (IQR) | 3.9% | 4.5% |
| Standard Deviation (Sample) | 3.3% | 5.4% |
| Standard Deviation (Population) | 3.3% | 5.3% |
Similar Demographics by Cognitive Disability
Demographics Similar to Thais by Cognitive Disability
In terms of cognitive disability, the demographic groups most similar to Thais are Immigrants from Ireland (16.1%, a difference of 0.11%), Immigrants from Poland (16.1%, a difference of 0.13%), Assyrian/Chaldean/Syriac (16.2%, a difference of 0.45%), Immigrants from Scotland (16.2%, a difference of 0.50%), and Immigrants from Czechoslovakia (16.2%, a difference of 0.58%).
| Demographics | Rating | Rank | Cognitive Disability |
| Immigrants | Taiwan | 100.0 /100 | #1 | Exceptional 15.7% |
| Immigrants | India | 100.0 /100 | #2 | Exceptional 15.9% |
| Chinese | 100.0 /100 | #3 | Exceptional 15.9% |
| Immigrants | Lithuania | 100.0 /100 | #4 | Exceptional 16.0% |
| Immigrants | Hong Kong | 100.0 /100 | #5 | Exceptional 16.0% |
| Thais | 100.0 /100 | #6 | Exceptional 16.1% |
| Immigrants | Ireland | 100.0 /100 | #7 | Exceptional 16.1% |
| Immigrants | Poland | 100.0 /100 | #8 | Exceptional 16.1% |
| Assyrians/Chaldeans/Syriacs | 100.0 /100 | #9 | Exceptional 16.2% |
| Immigrants | Scotland | 100.0 /100 | #10 | Exceptional 16.2% |
| Immigrants | Czechoslovakia | 100.0 /100 | #11 | Exceptional 16.2% |
| Maltese | 100.0 /100 | #12 | Exceptional 16.2% |
| Lithuanians | 100.0 /100 | #13 | Exceptional 16.3% |
| Immigrants | Austria | 100.0 /100 | #14 | Exceptional 16.3% |
| Immigrants | Greece | 100.0 /100 | #15 | Exceptional 16.3% |
Demographics Similar to Immigrants from England by Cognitive Disability
In terms of cognitive disability, the demographic groups most similar to Immigrants from England are Czechoslovakian (16.6%, a difference of 0.030%), Argentinean (16.6%, a difference of 0.050%), Romanian (16.6%, a difference of 0.060%), Pennsylvania German (16.6%, a difference of 0.070%), and Immigrants from Peru (16.6%, a difference of 0.070%).
| Demographics | Rating | Rank | Cognitive Disability |
| Immigrants | Iran | 99.8 /100 | #54 | Exceptional 16.5% |
| Immigrants | Venezuela | 99.7 /100 | #55 | Exceptional 16.5% |
| Austrians | 99.7 /100 | #56 | Exceptional 16.6% |
| Bhutanese | 99.7 /100 | #57 | Exceptional 16.6% |
| Pennsylvania Germans | 99.7 /100 | #58 | Exceptional 16.6% |
| Immigrants | Peru | 99.7 /100 | #59 | Exceptional 16.6% |
| Romanians | 99.7 /100 | #60 | Exceptional 16.6% |
| Immigrants | England | 99.6 /100 | #61 | Exceptional 16.6% |
| Czechoslovakians | 99.6 /100 | #62 | Exceptional 16.6% |
| Argentineans | 99.6 /100 | #63 | Exceptional 16.6% |
| Venezuelans | 99.6 /100 | #64 | Exceptional 16.6% |
| Colombians | 99.6 /100 | #65 | Exceptional 16.6% |
| Immigrants | Ukraine | 99.5 /100 | #66 | Exceptional 16.6% |
| Latvians | 99.5 /100 | #67 | Exceptional 16.6% |
| Ukrainians | 99.4 /100 | #68 | Exceptional 16.6% |