Thai vs Immigrants from Costa Rica College, Under 1 year
COMPARE
Thai
Immigrants from Costa Rica
College, Under 1 year
College, Under 1 year Comparison
Thais
Immigrants from Costa Rica
73.4%
COLLEGE, UNDER 1 YEAR
100.0/ 100
METRIC RATING
8th/ 347
METRIC RANK
63.2%
COLLEGE, UNDER 1 YEAR
4.5/ 100
METRIC RATING
223rd/ 347
METRIC RANK
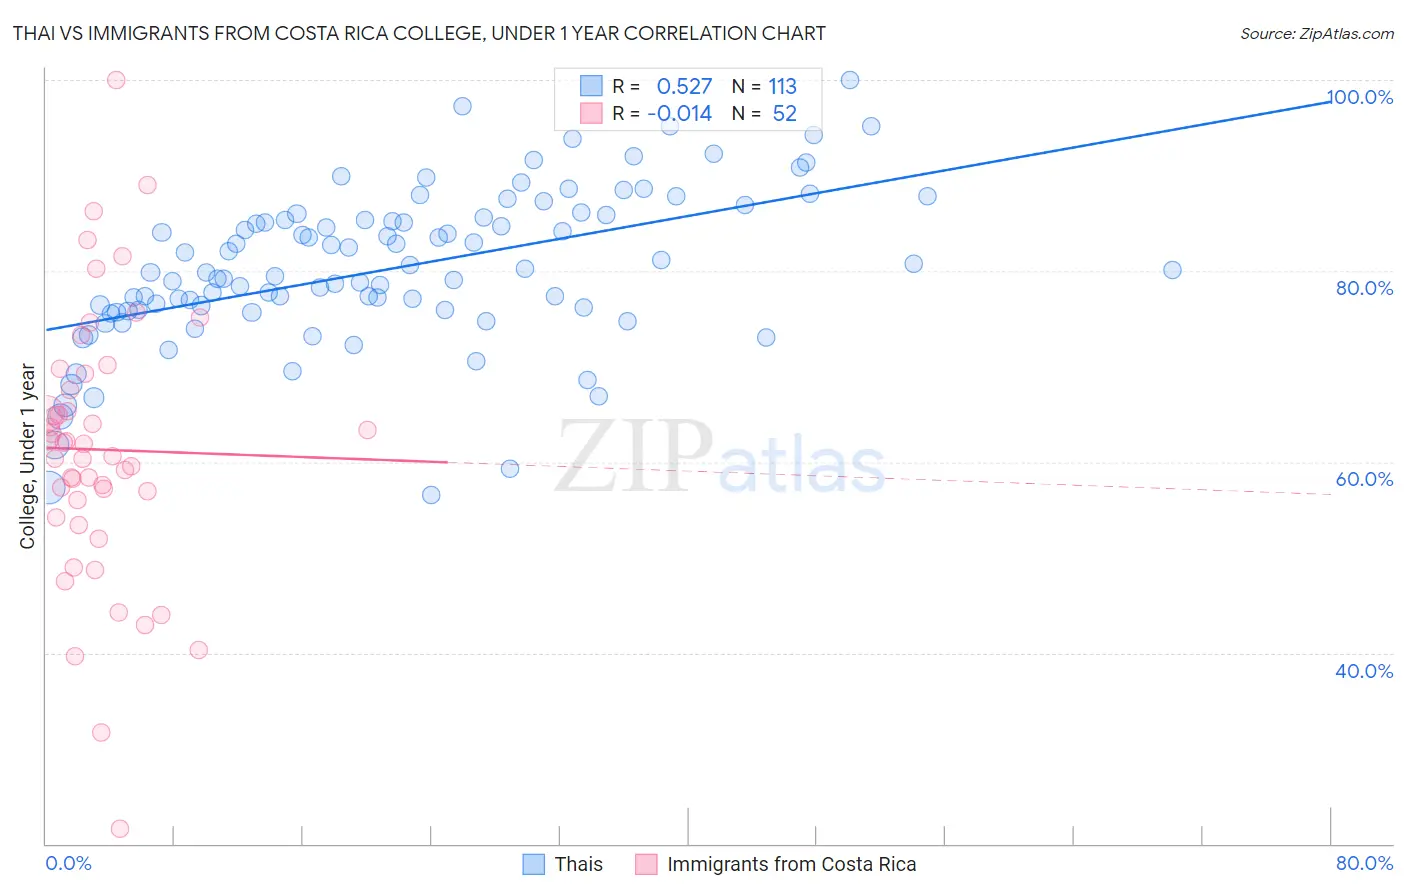
Thai vs Immigrants from Costa Rica College, Under 1 year Correlation Chart
The statistical analysis conducted on geographies consisting of 475,810,175 people shows a substantial positive correlation between the proportion of Thais and percentage of population with at least college, under 1 year education in the United States with a correlation coefficient (R) of 0.527 and weighted average of 73.4%. Similarly, the statistical analysis conducted on geographies consisting of 204,277,408 people shows no correlation between the proportion of Immigrants from Costa Rica and percentage of population with at least college, under 1 year education in the United States with a correlation coefficient (R) of -0.014 and weighted average of 63.2%, a difference of 16.2%.
College, Under 1 year Correlation Summary
| Measurement | Thai | Immigrants from Costa Rica |
| Minimum | 56.5% | 21.6% |
| Maximum | 100.0% | 100.0% |
| Range | 43.5% | 78.4% |
| Mean | 80.3% | 61.3% |
| Median | 79.9% | 61.2% |
| Interquartile 25% (IQ1) | 75.8% | 55.0% |
| Interquartile 75% (IQ3) | 85.5% | 68.4% |
| Interquartile Range (IQR) | 9.6% | 13.3% |
| Standard Deviation (Sample) | 8.2% | 14.2% |
| Standard Deviation (Population) | 8.2% | 14.1% |
Similar Demographics by College, Under 1 year
Demographics Similar to Thais by College, Under 1 year
In terms of college, under 1 year, the demographic groups most similar to Thais are Okinawan (73.7%, a difference of 0.33%), Immigrants from Australia (72.7%, a difference of 0.95%), Immigrants from Taiwan (74.2%, a difference of 1.0%), Immigrants from Iran (74.3%, a difference of 1.1%), and Immigrants from India (74.4%, a difference of 1.4%).
| Demographics | Rating | Rank | College, Under 1 year |
| Filipinos | 100.0 /100 | #1 | Exceptional 75.5% |
| Iranians | 100.0 /100 | #2 | Exceptional 74.9% |
| Immigrants | Singapore | 100.0 /100 | #3 | Exceptional 74.8% |
| Immigrants | India | 100.0 /100 | #4 | Exceptional 74.4% |
| Immigrants | Iran | 100.0 /100 | #5 | Exceptional 74.3% |
| Immigrants | Taiwan | 100.0 /100 | #6 | Exceptional 74.2% |
| Okinawans | 100.0 /100 | #7 | Exceptional 73.7% |
| Thais | 100.0 /100 | #8 | Exceptional 73.4% |
| Immigrants | Australia | 100.0 /100 | #9 | Exceptional 72.7% |
| Immigrants | Israel | 100.0 /100 | #10 | Exceptional 72.3% |
| Immigrants | South Central Asia | 100.0 /100 | #11 | Exceptional 72.1% |
| Immigrants | Sweden | 100.0 /100 | #12 | Exceptional 72.1% |
| Cypriots | 100.0 /100 | #13 | Exceptional 72.0% |
| Cambodians | 100.0 /100 | #14 | Exceptional 71.9% |
| Burmese | 100.0 /100 | #15 | Exceptional 71.9% |
Demographics Similar to Immigrants from Costa Rica by College, Under 1 year
In terms of college, under 1 year, the demographic groups most similar to Immigrants from Costa Rica are Subsaharan African (63.2%, a difference of 0.030%), Immigrants from Senegal (63.3%, a difference of 0.12%), Immigrants from Peru (63.1%, a difference of 0.13%), Immigrants from Colombia (63.1%, a difference of 0.15%), and Cree (63.3%, a difference of 0.17%).
| Demographics | Rating | Rank | College, Under 1 year |
| Hmong | 6.8 /100 | #216 | Tragic 63.5% |
| Immigrants | Uruguay | 5.8 /100 | #217 | Tragic 63.4% |
| Immigrants | Panama | 5.7 /100 | #218 | Tragic 63.4% |
| Immigrants | Fiji | 5.7 /100 | #219 | Tragic 63.4% |
| Portuguese | 5.6 /100 | #220 | Tragic 63.4% |
| Cree | 5.2 /100 | #221 | Tragic 63.3% |
| Immigrants | Senegal | 5.0 /100 | #222 | Tragic 63.3% |
| Immigrants | Costa Rica | 4.5 /100 | #223 | Tragic 63.2% |
| Sub-Saharan Africans | 4.4 /100 | #224 | Tragic 63.2% |
| Immigrants | Peru | 4.0 /100 | #225 | Tragic 63.1% |
| Immigrants | Colombia | 4.0 /100 | #226 | Tragic 63.1% |
| Immigrants | Ghana | 3.7 /100 | #227 | Tragic 63.1% |
| Samoans | 3.3 /100 | #228 | Tragic 63.0% |
| Liberians | 3.2 /100 | #229 | Tragic 63.0% |
| Immigrants | Nonimmigrants | 3.0 /100 | #230 | Tragic 62.9% |