Thai vs Immigrants from Costa Rica Unemployment Among Ages 16 to 19 years
COMPARE
Thai
Immigrants from Costa Rica
Unemployment Among Ages 16 to 19 years
Unemployment Among Ages 16 to 19 years Comparison
Thais
Immigrants from Costa Rica
15.7%
UNEMPLOYMENT AMONG AGES 16 TO 19 YEARS
100.0/ 100
METRIC RATING
18th/ 347
METRIC RANK
17.6%
UNEMPLOYMENT AMONG AGES 16 TO 19 YEARS
41.3/ 100
METRIC RATING
191st/ 347
METRIC RANK
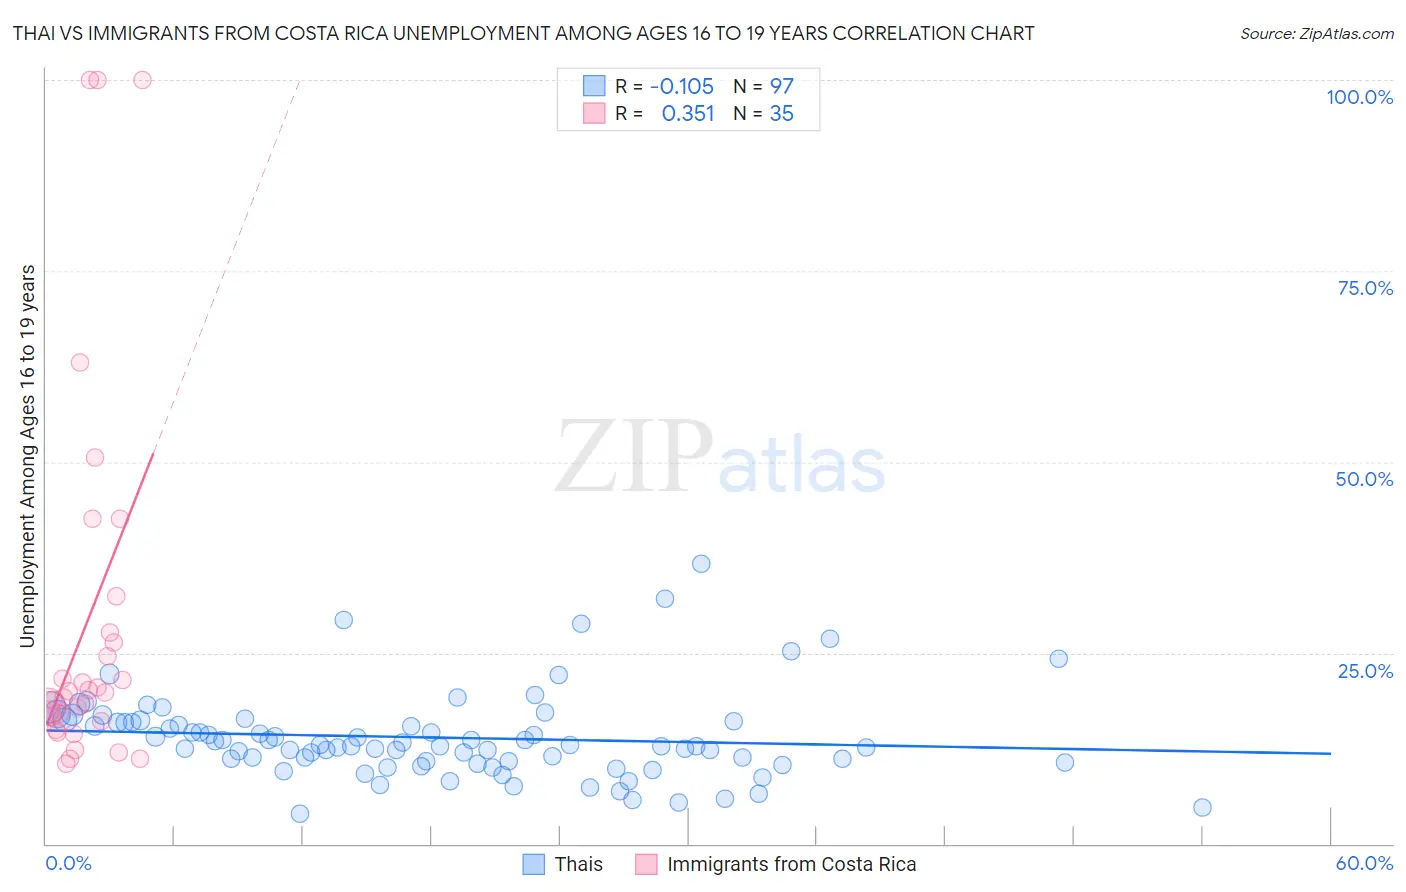
Thai vs Immigrants from Costa Rica Unemployment Among Ages 16 to 19 years Correlation Chart
The statistical analysis conducted on geographies consisting of 446,293,569 people shows a poor negative correlation between the proportion of Thais and unemployment rate among population between the ages 16 and 19 in the United States with a correlation coefficient (R) of -0.105 and weighted average of 15.7%. Similarly, the statistical analysis conducted on geographies consisting of 199,003,173 people shows a mild positive correlation between the proportion of Immigrants from Costa Rica and unemployment rate among population between the ages 16 and 19 in the United States with a correlation coefficient (R) of 0.351 and weighted average of 17.6%, a difference of 12.1%.
Unemployment Among Ages 16 to 19 years Correlation Summary
| Measurement | Thai | Immigrants from Costa Rica |
| Minimum | 3.9% | 10.4% |
| Maximum | 36.6% | 100.0% |
| Range | 32.7% | 89.6% |
| Mean | 13.9% | 29.0% |
| Median | 12.8% | 19.8% |
| Interquartile 25% (IQ1) | 10.7% | 16.1% |
| Interquartile 75% (IQ3) | 16.0% | 27.6% |
| Interquartile Range (IQR) | 5.3% | 11.5% |
| Standard Deviation (Sample) | 5.7% | 24.8% |
| Standard Deviation (Population) | 5.6% | 24.5% |
Similar Demographics by Unemployment Among Ages 16 to 19 years
Demographics Similar to Thais by Unemployment Among Ages 16 to 19 years
In terms of unemployment among ages 16 to 19 years, the demographic groups most similar to Thais are Swiss (15.8%, a difference of 0.11%), Sudanese (15.8%, a difference of 0.21%), Somali (15.7%, a difference of 0.24%), German (15.7%, a difference of 0.45%), and Immigrants from Taiwan (15.8%, a difference of 0.54%).
| Demographics | Rating | Rank | Unemployment Among Ages 16 to 19 years |
| Indonesians | 100.0 /100 | #11 | Exceptional 15.5% |
| Taiwanese | 100.0 /100 | #12 | Exceptional 15.5% |
| Immigrants | Burma/Myanmar | 100.0 /100 | #13 | Exceptional 15.6% |
| Immigrants | Zaire | 100.0 /100 | #14 | Exceptional 15.6% |
| Yugoslavians | 100.0 /100 | #15 | Exceptional 15.6% |
| Germans | 100.0 /100 | #16 | Exceptional 15.7% |
| Somalis | 100.0 /100 | #17 | Exceptional 15.7% |
| Thais | 100.0 /100 | #18 | Exceptional 15.7% |
| Swiss | 100.0 /100 | #19 | Exceptional 15.8% |
| Sudanese | 100.0 /100 | #20 | Exceptional 15.8% |
| Immigrants | Taiwan | 100.0 /100 | #21 | Exceptional 15.8% |
| Finns | 100.0 /100 | #22 | Exceptional 15.9% |
| Belgians | 100.0 /100 | #23 | Exceptional 15.9% |
| Tongans | 100.0 /100 | #24 | Exceptional 15.9% |
| Filipinos | 100.0 /100 | #25 | Exceptional 15.9% |
Demographics Similar to Immigrants from Costa Rica by Unemployment Among Ages 16 to 19 years
In terms of unemployment among ages 16 to 19 years, the demographic groups most similar to Immigrants from Costa Rica are Marshallese (17.6%, a difference of 0.020%), Immigrants from Europe (17.6%, a difference of 0.030%), Immigrants from Philippines (17.7%, a difference of 0.030%), Immigrants from Australia (17.7%, a difference of 0.030%), and Immigrants from Nicaragua (17.6%, a difference of 0.040%).
| Demographics | Rating | Rank | Unemployment Among Ages 16 to 19 years |
| Eastern Europeans | 44.3 /100 | #184 | Average 17.6% |
| Iroquois | 43.4 /100 | #185 | Average 17.6% |
| Japanese | 43.2 /100 | #186 | Average 17.6% |
| Immigrants | Micronesia | 42.4 /100 | #187 | Average 17.6% |
| Immigrants | Nicaragua | 42.2 /100 | #188 | Average 17.6% |
| Immigrants | Europe | 41.8 /100 | #189 | Average 17.6% |
| Marshallese | 41.7 /100 | #190 | Average 17.6% |
| Immigrants | Costa Rica | 41.3 /100 | #191 | Average 17.6% |
| Immigrants | Philippines | 40.7 /100 | #192 | Average 17.7% |
| Immigrants | Australia | 40.6 /100 | #193 | Average 17.7% |
| Peruvians | 38.8 /100 | #194 | Fair 17.7% |
| Immigrants | Peru | 37.3 /100 | #195 | Fair 17.7% |
| Alaskan Athabascans | 34.1 /100 | #196 | Fair 17.7% |
| Immigrants | Czechoslovakia | 29.8 /100 | #197 | Fair 17.8% |
| Ethiopians | 29.6 /100 | #198 | Fair 17.8% |