Russian vs Uruguayan Disability Age Under 5
COMPARE
Russian
Uruguayan
Disability Age Under 5
Disability Age Under 5 Comparison
Russians
Uruguayans
1.4%
DISABILITY AGE UNDER 5
1.0/ 100
METRIC RATING
246th/ 347
METRIC RANK
1.2%
DISABILITY AGE UNDER 5
68.8/ 100
METRIC RATING
154th/ 347
METRIC RANK
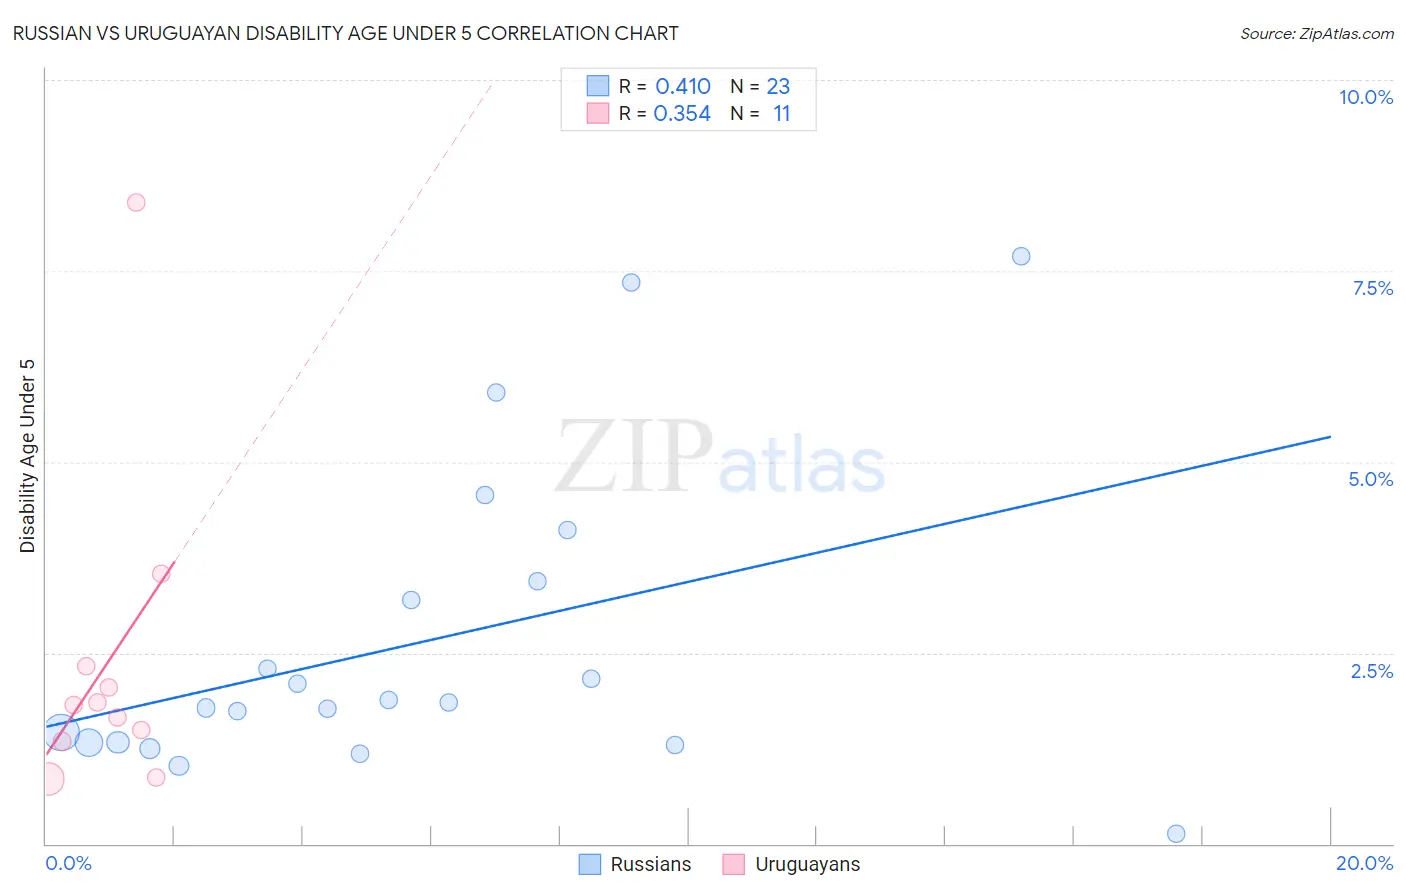
Russian vs Uruguayan Disability Age Under 5 Correlation Chart
The statistical analysis conducted on geographies consisting of 247,754,409 people shows a moderate positive correlation between the proportion of Russians and percentage of population with a disability under the age of 5 in the United States with a correlation coefficient (R) of 0.410 and weighted average of 1.4%. Similarly, the statistical analysis conducted on geographies consisting of 100,557,895 people shows a mild positive correlation between the proportion of Uruguayans and percentage of population with a disability under the age of 5 in the United States with a correlation coefficient (R) of 0.354 and weighted average of 1.2%, a difference of 12.3%.
Disability Age Under 5 Correlation Summary
| Measurement | Russian | Uruguayan |
| Minimum | 0.14% | 0.85% |
| Maximum | 7.7% | 8.4% |
| Range | 7.6% | 7.6% |
| Mean | 2.6% | 2.4% |
| Median | 1.8% | 1.8% |
| Interquartile 25% (IQ1) | 1.3% | 1.3% |
| Interquartile 75% (IQ3) | 3.4% | 2.3% |
| Interquartile Range (IQR) | 2.1% | 0.97% |
| Standard Deviation (Sample) | 2.0% | 2.1% |
| Standard Deviation (Population) | 2.0% | 2.0% |
Similar Demographics by Disability Age Under 5
Demographics Similar to Russians by Disability Age Under 5
In terms of disability age under 5, the demographic groups most similar to Russians are Immigrants from England (1.4%, a difference of 0.010%), Eastern European (1.4%, a difference of 0.050%), Potawatomi (1.4%, a difference of 0.13%), Bermudan (1.4%, a difference of 0.13%), and African (1.4%, a difference of 0.14%).
| Demographics | Rating | Rank | Disability Age Under 5 |
| Immigrants | Austria | 2.3 /100 | #239 | Tragic 1.3% |
| Native Hawaiians | 2.2 /100 | #240 | Tragic 1.3% |
| Maltese | 2.2 /100 | #241 | Tragic 1.3% |
| Lumbee | 2.1 /100 | #242 | Tragic 1.3% |
| Immigrants | Cameroon | 1.7 /100 | #243 | Tragic 1.4% |
| Spaniards | 1.4 /100 | #244 | Tragic 1.4% |
| Potawatomi | 1.1 /100 | #245 | Tragic 1.4% |
| Russians | 1.0 /100 | #246 | Tragic 1.4% |
| Immigrants | England | 1.0 /100 | #247 | Tragic 1.4% |
| Eastern Europeans | 1.0 /100 | #248 | Tragic 1.4% |
| Bermudans | 1.0 /100 | #249 | Tragic 1.4% |
| Africans | 1.0 /100 | #250 | Tragic 1.4% |
| Immigrants | Hungary | 1.0 /100 | #251 | Tragic 1.4% |
| Immigrants | Scotland | 0.9 /100 | #252 | Tragic 1.4% |
| Australians | 0.7 /100 | #253 | Tragic 1.4% |
Demographics Similar to Uruguayans by Disability Age Under 5
In terms of disability age under 5, the demographic groups most similar to Uruguayans are Immigrants from Ghana (1.2%, a difference of 0.010%), Hawaiian (1.2%, a difference of 0.030%), Immigrants from Thailand (1.2%, a difference of 0.070%), Immigrants from South America (1.2%, a difference of 0.19%), and Arab (1.2%, a difference of 0.25%).
| Demographics | Rating | Rank | Disability Age Under 5 |
| Icelanders | 76.3 /100 | #147 | Good 1.2% |
| Ghanaians | 76.3 /100 | #148 | Good 1.2% |
| Kenyans | 75.9 /100 | #149 | Good 1.2% |
| South Americans | 75.6 /100 | #150 | Good 1.2% |
| Yaqui | 74.8 /100 | #151 | Good 1.2% |
| Hondurans | 72.5 /100 | #152 | Good 1.2% |
| Immigrants | Thailand | 69.4 /100 | #153 | Good 1.2% |
| Uruguayans | 68.8 /100 | #154 | Good 1.2% |
| Immigrants | Ghana | 68.7 /100 | #155 | Good 1.2% |
| Hawaiians | 68.5 /100 | #156 | Good 1.2% |
| Immigrants | South America | 67.0 /100 | #157 | Good 1.2% |
| Arabs | 66.4 /100 | #158 | Good 1.2% |
| Colombians | 65.8 /100 | #159 | Good 1.2% |
| Immigrants | Latin America | 65.8 /100 | #160 | Good 1.2% |
| Immigrants | Africa | 65.1 /100 | #161 | Good 1.2% |