Taiwanese vs Uruguayan Disability Age 35 to 64
COMPARE
Taiwanese
Uruguayan
Disability Age 35 to 64
Disability Age 35 to 64 Comparison
Taiwanese
Uruguayans
9.8%
DISABILITY AGE 35 TO 64
99.8/ 100
METRIC RATING
53rd/ 347
METRIC RANK
10.2%
DISABILITY AGE 35 TO 64
99.0/ 100
METRIC RATING
89th/ 347
METRIC RANK
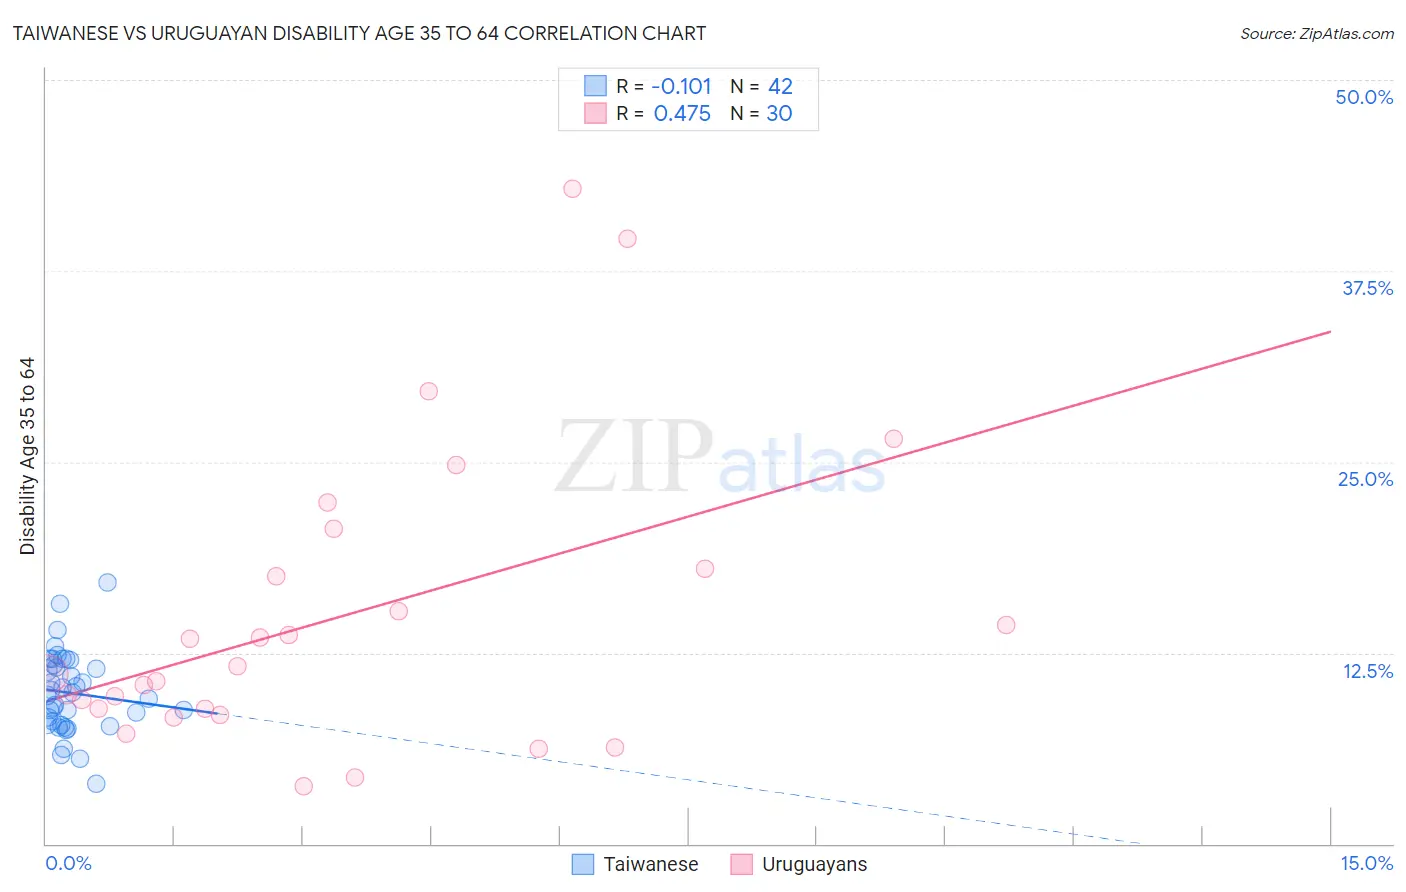
Taiwanese vs Uruguayan Disability Age 35 to 64 Correlation Chart
The statistical analysis conducted on geographies consisting of 31,711,988 people shows a poor negative correlation between the proportion of Taiwanese and percentage of population with a disability between the ages 34 and 64 in the United States with a correlation coefficient (R) of -0.101 and weighted average of 9.8%. Similarly, the statistical analysis conducted on geographies consisting of 144,764,397 people shows a moderate positive correlation between the proportion of Uruguayans and percentage of population with a disability between the ages 34 and 64 in the United States with a correlation coefficient (R) of 0.475 and weighted average of 10.2%, a difference of 4.0%.
Disability Age 35 to 64 Correlation Summary
| Measurement | Taiwanese | Uruguayan |
| Minimum | 4.0% | 3.7% |
| Maximum | 17.1% | 42.9% |
| Range | 13.1% | 39.1% |
| Mean | 9.9% | 14.9% |
| Median | 9.8% | 11.4% |
| Interquartile 25% (IQ1) | 7.8% | 8.8% |
| Interquartile 75% (IQ3) | 11.7% | 18.0% |
| Interquartile Range (IQR) | 3.9% | 9.2% |
| Standard Deviation (Sample) | 2.6% | 9.7% |
| Standard Deviation (Population) | 2.6% | 9.5% |
Similar Demographics by Disability Age 35 to 64
Demographics Similar to Taiwanese by Disability Age 35 to 64
In terms of disability age 35 to 64, the demographic groups most similar to Taiwanese are Immigrants from Russia (9.8%, a difference of 0.040%), Immigrants from Bulgaria (9.8%, a difference of 0.060%), Bhutanese (9.8%, a difference of 0.070%), Peruvian (9.9%, a difference of 0.10%), and Paraguayan (9.8%, a difference of 0.15%).
| Demographics | Rating | Rank | Disability Age 35 to 64 |
| Cambodians | 99.8 /100 | #46 | Exceptional 9.8% |
| Immigrants | Belgium | 99.8 /100 | #47 | Exceptional 9.8% |
| Immigrants | Serbia | 99.8 /100 | #48 | Exceptional 9.8% |
| Immigrants | Greece | 99.8 /100 | #49 | Exceptional 9.8% |
| Paraguayans | 99.8 /100 | #50 | Exceptional 9.8% |
| Bhutanese | 99.8 /100 | #51 | Exceptional 9.8% |
| Immigrants | Bulgaria | 99.8 /100 | #52 | Exceptional 9.8% |
| Taiwanese | 99.8 /100 | #53 | Exceptional 9.8% |
| Immigrants | Russia | 99.8 /100 | #54 | Exceptional 9.8% |
| Peruvians | 99.8 /100 | #55 | Exceptional 9.9% |
| South Americans | 99.8 /100 | #56 | Exceptional 9.9% |
| Colombians | 99.8 /100 | #57 | Exceptional 9.9% |
| Armenians | 99.8 /100 | #58 | Exceptional 9.9% |
| Immigrants | Sweden | 99.7 /100 | #59 | Exceptional 9.9% |
| Immigrants | South America | 99.7 /100 | #60 | Exceptional 9.9% |
Demographics Similar to Uruguayans by Disability Age 35 to 64
In terms of disability age 35 to 64, the demographic groups most similar to Uruguayans are Chilean (10.2%, a difference of 0.010%), Afghan (10.3%, a difference of 0.11%), Immigrants from Lebanon (10.3%, a difference of 0.12%), Immigrants from Europe (10.2%, a difference of 0.25%), and Nicaraguan (10.2%, a difference of 0.25%).
| Demographics | Rating | Rank | Disability Age 35 to 64 |
| Russians | 99.2 /100 | #82 | Exceptional 10.2% |
| Immigrants | Brazil | 99.2 /100 | #83 | Exceptional 10.2% |
| Sri Lankans | 99.2 /100 | #84 | Exceptional 10.2% |
| Immigrants | Kuwait | 99.1 /100 | #85 | Exceptional 10.2% |
| Immigrants | Europe | 99.1 /100 | #86 | Exceptional 10.2% |
| Nicaraguans | 99.1 /100 | #87 | Exceptional 10.2% |
| Chileans | 99.0 /100 | #88 | Exceptional 10.2% |
| Uruguayans | 99.0 /100 | #89 | Exceptional 10.2% |
| Afghans | 98.9 /100 | #90 | Exceptional 10.3% |
| Immigrants | Lebanon | 98.9 /100 | #91 | Exceptional 10.3% |
| Immigrants | Northern Africa | 98.7 /100 | #92 | Exceptional 10.3% |
| Immigrants | North Macedonia | 98.7 /100 | #93 | Exceptional 10.3% |
| Immigrants | Italy | 98.7 /100 | #94 | Exceptional 10.3% |
| Chinese | 98.7 /100 | #95 | Exceptional 10.3% |
| Immigrants | South Africa | 98.5 /100 | #96 | Exceptional 10.3% |