Syrian vs Samoan Vision Disability
COMPARE
Syrian
Samoan
Vision Disability
Vision Disability Comparison
Syrians
Samoans
2.1%
VISION DISABILITY
87.5/ 100
METRIC RATING
133rd/ 347
METRIC RANK
2.2%
VISION DISABILITY
15.7/ 100
METRIC RATING
205th/ 347
METRIC RANK
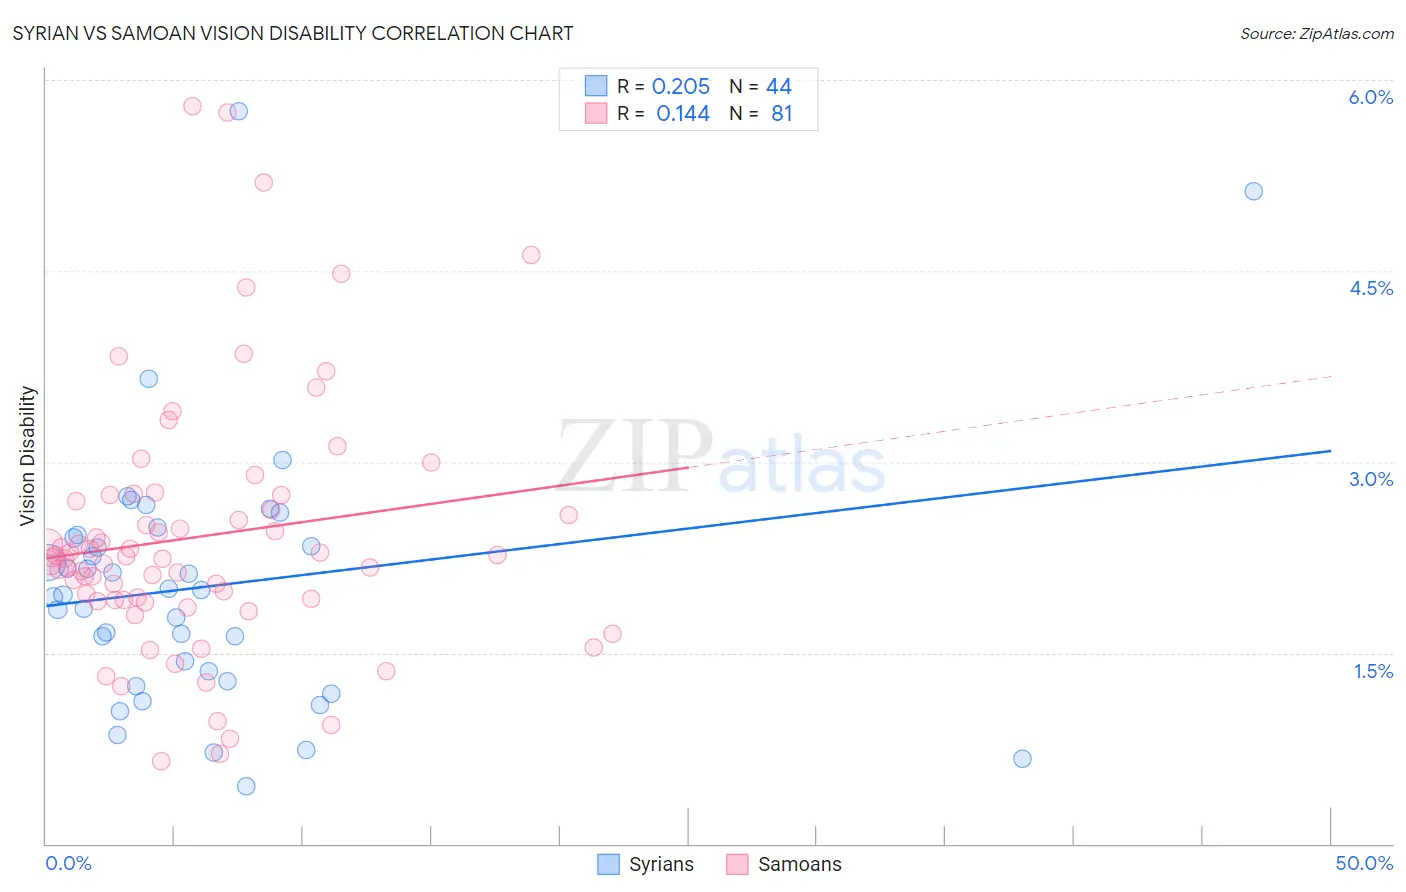
Syrian vs Samoan Vision Disability Correlation Chart
The statistical analysis conducted on geographies consisting of 266,224,532 people shows a weak positive correlation between the proportion of Syrians and percentage of population with vision disability in the United States with a correlation coefficient (R) of 0.205 and weighted average of 2.1%. Similarly, the statistical analysis conducted on geographies consisting of 225,065,967 people shows a poor positive correlation between the proportion of Samoans and percentage of population with vision disability in the United States with a correlation coefficient (R) of 0.144 and weighted average of 2.2%, a difference of 5.9%.
Vision Disability Correlation Summary
| Measurement | Syrian | Samoan |
| Minimum | 0.46% | 0.64% |
| Maximum | 5.8% | 5.8% |
| Range | 5.3% | 5.1% |
| Mean | 2.0% | 2.4% |
| Median | 2.0% | 2.2% |
| Interquartile 25% (IQ1) | 1.3% | 1.9% |
| Interquartile 75% (IQ3) | 2.4% | 2.7% |
| Interquartile Range (IQR) | 1.1% | 0.80% |
| Standard Deviation (Sample) | 1.0% | 1.0% |
| Standard Deviation (Population) | 1.0% | 1.00% |
Similar Demographics by Vision Disability
Demographics Similar to Syrians by Vision Disability
In terms of vision disability, the demographic groups most similar to Syrians are Venezuelan (2.1%, a difference of 0.050%), New Zealander (2.1%, a difference of 0.10%), Vietnamese (2.1%, a difference of 0.12%), Immigrants from Hungary (2.1%, a difference of 0.17%), and Czech (2.1%, a difference of 0.17%).
| Demographics | Rating | Rank | Vision Disability |
| Immigrants | Peru | 89.5 /100 | #126 | Excellent 2.1% |
| Sudanese | 89.2 /100 | #127 | Excellent 2.1% |
| Immigrants | Chile | 89.0 /100 | #128 | Excellent 2.1% |
| Immigrants | Cameroon | 88.8 /100 | #129 | Excellent 2.1% |
| Immigrants | Kenya | 88.7 /100 | #130 | Excellent 2.1% |
| Immigrants | Hungary | 88.7 /100 | #131 | Excellent 2.1% |
| New Zealanders | 88.2 /100 | #132 | Excellent 2.1% |
| Syrians | 87.5 /100 | #133 | Excellent 2.1% |
| Venezuelans | 87.2 /100 | #134 | Excellent 2.1% |
| Vietnamese | 86.7 /100 | #135 | Excellent 2.1% |
| Czechs | 86.3 /100 | #136 | Excellent 2.1% |
| Immigrants | South Eastern Asia | 86.3 /100 | #137 | Excellent 2.1% |
| Arabs | 86.3 /100 | #138 | Excellent 2.1% |
| Immigrants | Morocco | 85.2 /100 | #139 | Excellent 2.1% |
| Immigrants | Netherlands | 84.2 /100 | #140 | Excellent 2.1% |
Demographics Similar to Samoans by Vision Disability
In terms of vision disability, the demographic groups most similar to Samoans are Immigrants from Guyana (2.2%, a difference of 0.030%), Pennsylvania German (2.2%, a difference of 0.14%), Dutch (2.2%, a difference of 0.16%), Immigrants from Zaire (2.2%, a difference of 0.25%), and Immigrants from Nigeria (2.2%, a difference of 0.27%).
| Demographics | Rating | Rank | Vision Disability |
| Czechoslovakians | 21.6 /100 | #198 | Fair 2.2% |
| Immigrants | El Salvador | 21.0 /100 | #199 | Fair 2.2% |
| Immigrants | Thailand | 20.1 /100 | #200 | Fair 2.2% |
| Slovaks | 18.8 /100 | #201 | Poor 2.2% |
| Immigrants | Zaire | 18.0 /100 | #202 | Poor 2.2% |
| Dutch | 17.1 /100 | #203 | Poor 2.2% |
| Immigrants | Guyana | 15.9 /100 | #204 | Poor 2.2% |
| Samoans | 15.7 /100 | #205 | Poor 2.2% |
| Pennsylvania Germans | 14.5 /100 | #206 | Poor 2.2% |
| Immigrants | Nigeria | 13.5 /100 | #207 | Poor 2.2% |
| Germans | 13.4 /100 | #208 | Poor 2.2% |
| Immigrants | Brazil | 13.1 /100 | #209 | Poor 2.2% |
| Immigrants | Uruguay | 11.5 /100 | #210 | Poor 2.2% |
| Indonesians | 9.5 /100 | #211 | Tragic 2.2% |
| Bermudans | 9.0 /100 | #212 | Tragic 2.2% |