Danish vs Samoan Vision Disability
COMPARE
Danish
Samoan
Vision Disability
Vision Disability Comparison
Danes
Samoans
2.1%
VISION DISABILITY
94.2/ 100
METRIC RATING
107th/ 347
METRIC RANK
2.2%
VISION DISABILITY
15.7/ 100
METRIC RATING
205th/ 347
METRIC RANK
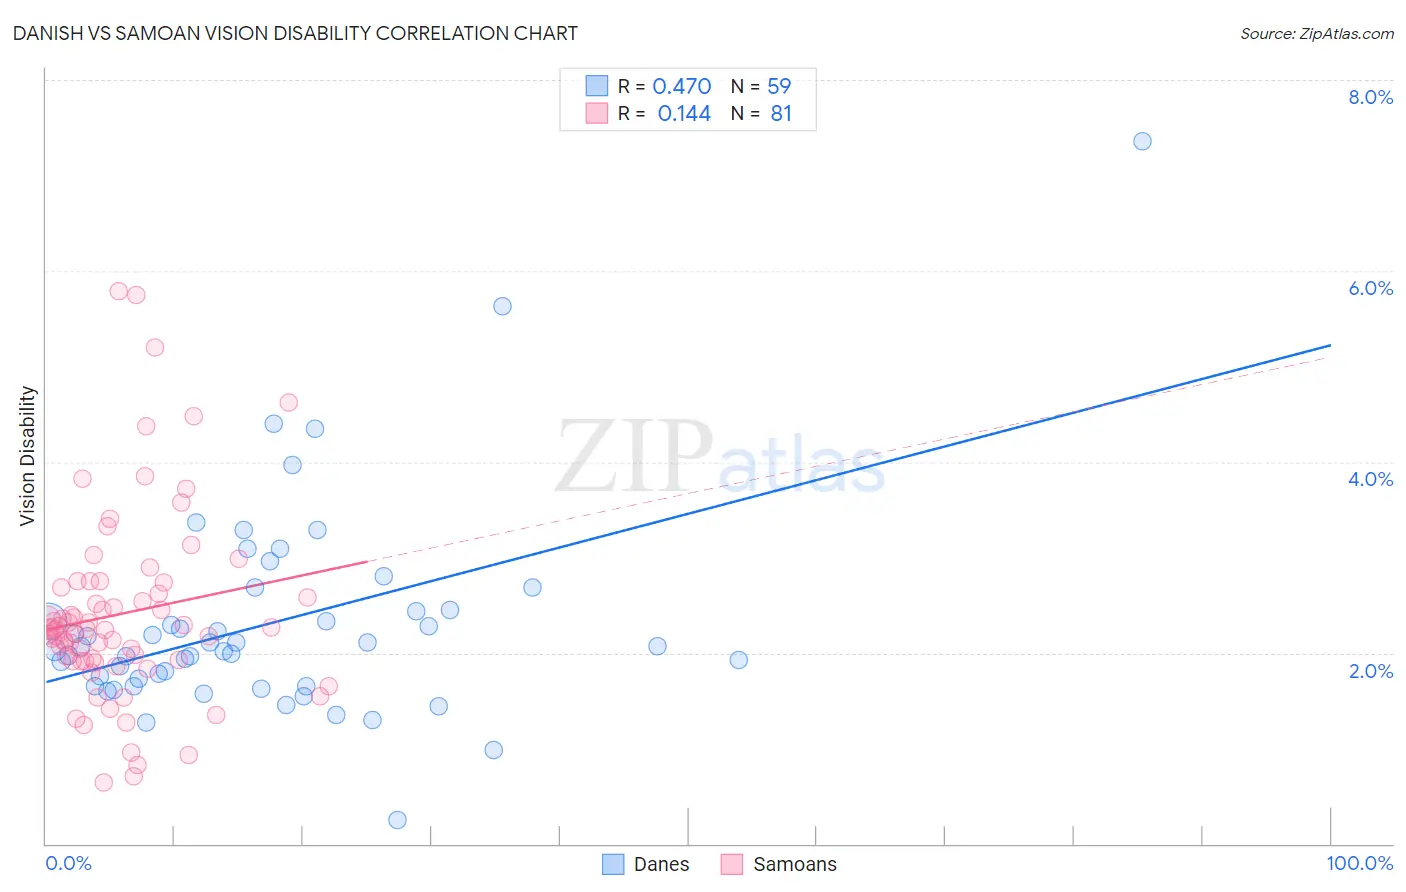
Danish vs Samoan Vision Disability Correlation Chart
The statistical analysis conducted on geographies consisting of 473,415,452 people shows a moderate positive correlation between the proportion of Danes and percentage of population with vision disability in the United States with a correlation coefficient (R) of 0.470 and weighted average of 2.1%. Similarly, the statistical analysis conducted on geographies consisting of 225,065,967 people shows a poor positive correlation between the proportion of Samoans and percentage of population with vision disability in the United States with a correlation coefficient (R) of 0.144 and weighted average of 2.2%, a difference of 7.3%.
Vision Disability Correlation Summary
| Measurement | Danish | Samoan |
| Minimum | 0.25% | 0.64% |
| Maximum | 7.4% | 5.8% |
| Range | 7.1% | 5.1% |
| Mean | 2.3% | 2.4% |
| Median | 2.1% | 2.2% |
| Interquartile 25% (IQ1) | 1.7% | 1.9% |
| Interquartile 75% (IQ3) | 2.5% | 2.7% |
| Interquartile Range (IQR) | 0.80% | 0.80% |
| Standard Deviation (Sample) | 1.1% | 1.0% |
| Standard Deviation (Population) | 1.1% | 1.00% |
Similar Demographics by Vision Disability
Demographics Similar to Danes by Vision Disability
In terms of vision disability, the demographic groups most similar to Danes are Swedish (2.1%, a difference of 0.010%), Korean (2.1%, a difference of 0.030%), Carpatho Rusyn (2.1%, a difference of 0.050%), Chilean (2.1%, a difference of 0.050%), and Immigrants from Italy (2.1%, a difference of 0.060%).
| Demographics | Rating | Rank | Vision Disability |
| Greeks | 95.1 /100 | #100 | Exceptional 2.1% |
| Albanians | 94.9 /100 | #101 | Exceptional 2.1% |
| Sri Lankans | 94.8 /100 | #102 | Exceptional 2.1% |
| Immigrants | Austria | 94.4 /100 | #103 | Exceptional 2.1% |
| Immigrants | Italy | 94.4 /100 | #104 | Exceptional 2.1% |
| Carpatho Rusyns | 94.3 /100 | #105 | Exceptional 2.1% |
| Swedes | 94.2 /100 | #106 | Exceptional 2.1% |
| Danes | 94.2 /100 | #107 | Exceptional 2.1% |
| Koreans | 94.1 /100 | #108 | Exceptional 2.1% |
| Chileans | 94.0 /100 | #109 | Exceptional 2.1% |
| Immigrants | Armenia | 93.8 /100 | #110 | Exceptional 2.1% |
| Peruvians | 93.5 /100 | #111 | Exceptional 2.1% |
| Immigrants | Denmark | 92.9 /100 | #112 | Exceptional 2.1% |
| Kenyans | 92.5 /100 | #113 | Exceptional 2.1% |
| Croatians | 92.3 /100 | #114 | Exceptional 2.1% |
Demographics Similar to Samoans by Vision Disability
In terms of vision disability, the demographic groups most similar to Samoans are Immigrants from Guyana (2.2%, a difference of 0.030%), Pennsylvania German (2.2%, a difference of 0.14%), Dutch (2.2%, a difference of 0.16%), Immigrants from Zaire (2.2%, a difference of 0.25%), and Immigrants from Nigeria (2.2%, a difference of 0.27%).
| Demographics | Rating | Rank | Vision Disability |
| Czechoslovakians | 21.6 /100 | #198 | Fair 2.2% |
| Immigrants | El Salvador | 21.0 /100 | #199 | Fair 2.2% |
| Immigrants | Thailand | 20.1 /100 | #200 | Fair 2.2% |
| Slovaks | 18.8 /100 | #201 | Poor 2.2% |
| Immigrants | Zaire | 18.0 /100 | #202 | Poor 2.2% |
| Dutch | 17.1 /100 | #203 | Poor 2.2% |
| Immigrants | Guyana | 15.9 /100 | #204 | Poor 2.2% |
| Samoans | 15.7 /100 | #205 | Poor 2.2% |
| Pennsylvania Germans | 14.5 /100 | #206 | Poor 2.2% |
| Immigrants | Nigeria | 13.5 /100 | #207 | Poor 2.2% |
| Germans | 13.4 /100 | #208 | Poor 2.2% |
| Immigrants | Brazil | 13.1 /100 | #209 | Poor 2.2% |
| Immigrants | Uruguay | 11.5 /100 | #210 | Poor 2.2% |
| Indonesians | 9.5 /100 | #211 | Tragic 2.2% |
| Bermudans | 9.0 /100 | #212 | Tragic 2.2% |