Syrian vs Samoan 11th Grade
COMPARE
Syrian
Samoan
11th Grade
11th Grade Comparison
Syrians
Samoans
93.4%
11TH GRADE
98.4/ 100
METRIC RATING
110th/ 347
METRIC RANK
92.3%
11TH GRADE
25.1/ 100
METRIC RATING
200th/ 347
METRIC RANK
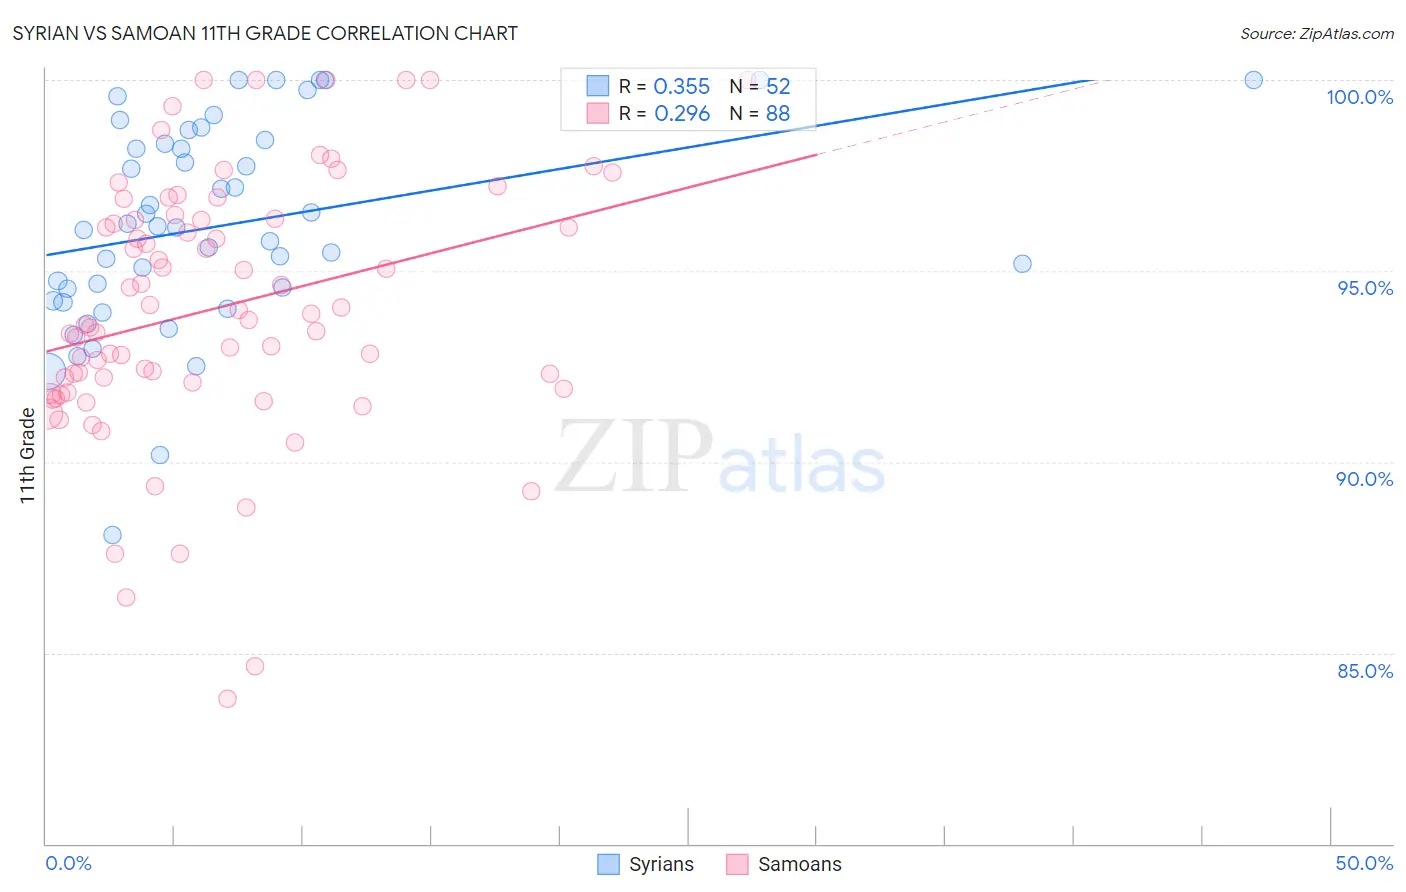
Syrian vs Samoan 11th Grade Correlation Chart
The statistical analysis conducted on geographies consisting of 266,305,988 people shows a mild positive correlation between the proportion of Syrians and percentage of population with at least 11th grade education in the United States with a correlation coefficient (R) of 0.355 and weighted average of 93.4%. Similarly, the statistical analysis conducted on geographies consisting of 225,205,818 people shows a weak positive correlation between the proportion of Samoans and percentage of population with at least 11th grade education in the United States with a correlation coefficient (R) of 0.296 and weighted average of 92.3%, a difference of 1.3%.
11th Grade Correlation Summary
| Measurement | Syrian | Samoan |
| Minimum | 88.1% | 83.8% |
| Maximum | 100.0% | 100.0% |
| Range | 11.9% | 16.2% |
| Mean | 96.2% | 94.0% |
| Median | 96.2% | 93.8% |
| Interquartile 25% (IQ1) | 94.4% | 92.0% |
| Interquartile 75% (IQ3) | 98.4% | 96.4% |
| Interquartile Range (IQR) | 4.0% | 4.4% |
| Standard Deviation (Sample) | 2.7% | 3.4% |
| Standard Deviation (Population) | 2.7% | 3.4% |
Similar Demographics by 11th Grade
Demographics Similar to Syrians by 11th Grade
In terms of 11th grade, the demographic groups most similar to Syrians are Immigrants from Norway (93.5%, a difference of 0.010%), Alaska Native (93.5%, a difference of 0.010%), Immigrants from Kuwait (93.5%, a difference of 0.010%), Lebanese (93.5%, a difference of 0.040%), and Immigrants from Europe (93.5%, a difference of 0.040%).
| Demographics | Rating | Rank | 11th Grade |
| Lebanese | 98.6 /100 | #103 | Exceptional 93.5% |
| Immigrants | Europe | 98.6 /100 | #104 | Exceptional 93.5% |
| Immigrants | Serbia | 98.6 /100 | #105 | Exceptional 93.5% |
| Immigrants | Croatia | 98.6 /100 | #106 | Exceptional 93.5% |
| Immigrants | Norway | 98.4 /100 | #107 | Exceptional 93.5% |
| Alaska Natives | 98.4 /100 | #108 | Exceptional 93.5% |
| Immigrants | Kuwait | 98.4 /100 | #109 | Exceptional 93.5% |
| Syrians | 98.4 /100 | #110 | Exceptional 93.4% |
| Yugoslavians | 98.1 /100 | #111 | Exceptional 93.4% |
| Immigrants | Germany | 98.0 /100 | #112 | Exceptional 93.4% |
| Immigrants | Zimbabwe | 97.8 /100 | #113 | Exceptional 93.4% |
| Jordanians | 97.8 /100 | #114 | Exceptional 93.4% |
| Palestinians | 97.7 /100 | #115 | Exceptional 93.4% |
| Immigrants | Hungary | 97.5 /100 | #116 | Exceptional 93.4% |
| Whites/Caucasians | 97.4 /100 | #117 | Exceptional 93.3% |
Demographics Similar to Samoans by 11th Grade
In terms of 11th grade, the demographic groups most similar to Samoans are Immigrants from Uganda (92.3%, a difference of 0.0%), Immigrants from China (92.3%, a difference of 0.0%), Marshallese (92.3%, a difference of 0.010%), Hawaiian (92.3%, a difference of 0.010%), and Immigrants from Eastern Africa (92.3%, a difference of 0.010%).
| Demographics | Rating | Rank | 11th Grade |
| Moroccans | 28.7 /100 | #193 | Fair 92.3% |
| Sioux | 28.5 /100 | #194 | Fair 92.3% |
| Liberians | 26.8 /100 | #195 | Fair 92.3% |
| Panamanians | 26.4 /100 | #196 | Fair 92.3% |
| Marshallese | 26.0 /100 | #197 | Fair 92.3% |
| Hawaiians | 25.5 /100 | #198 | Fair 92.3% |
| Immigrants | Uganda | 25.2 /100 | #199 | Fair 92.3% |
| Samoans | 25.1 /100 | #200 | Fair 92.3% |
| Immigrants | China | 25.1 /100 | #201 | Fair 92.3% |
| Immigrants | Eastern Africa | 24.1 /100 | #202 | Fair 92.3% |
| Immigrants | Sudan | 23.5 /100 | #203 | Fair 92.3% |
| Immigrants | Hong Kong | 23.3 /100 | #204 | Fair 92.2% |
| Kiowa | 23.2 /100 | #205 | Fair 92.2% |
| Bolivians | 23.2 /100 | #206 | Fair 92.2% |
| Immigrants | Oceania | 22.4 /100 | #207 | Fair 92.2% |