Syrian vs Samoan Unemployment Among Women with Children Ages 6 to 17 years
COMPARE
Syrian
Samoan
Unemployment Among Women with Children Ages 6 to 17 years
Unemployment Among Women with Children Ages 6 to 17 years Comparison
Syrians
Samoans
9.2%
UNEMPLOYMENT AMONG WOMEN WITH CHILDREN AGES 6 TO 17 YEARS
6.9/ 100
METRIC RATING
218th/ 347
METRIC RANK
8.4%
UNEMPLOYMENT AMONG WOMEN WITH CHILDREN AGES 6 TO 17 YEARS
99.7/ 100
METRIC RATING
74th/ 347
METRIC RANK
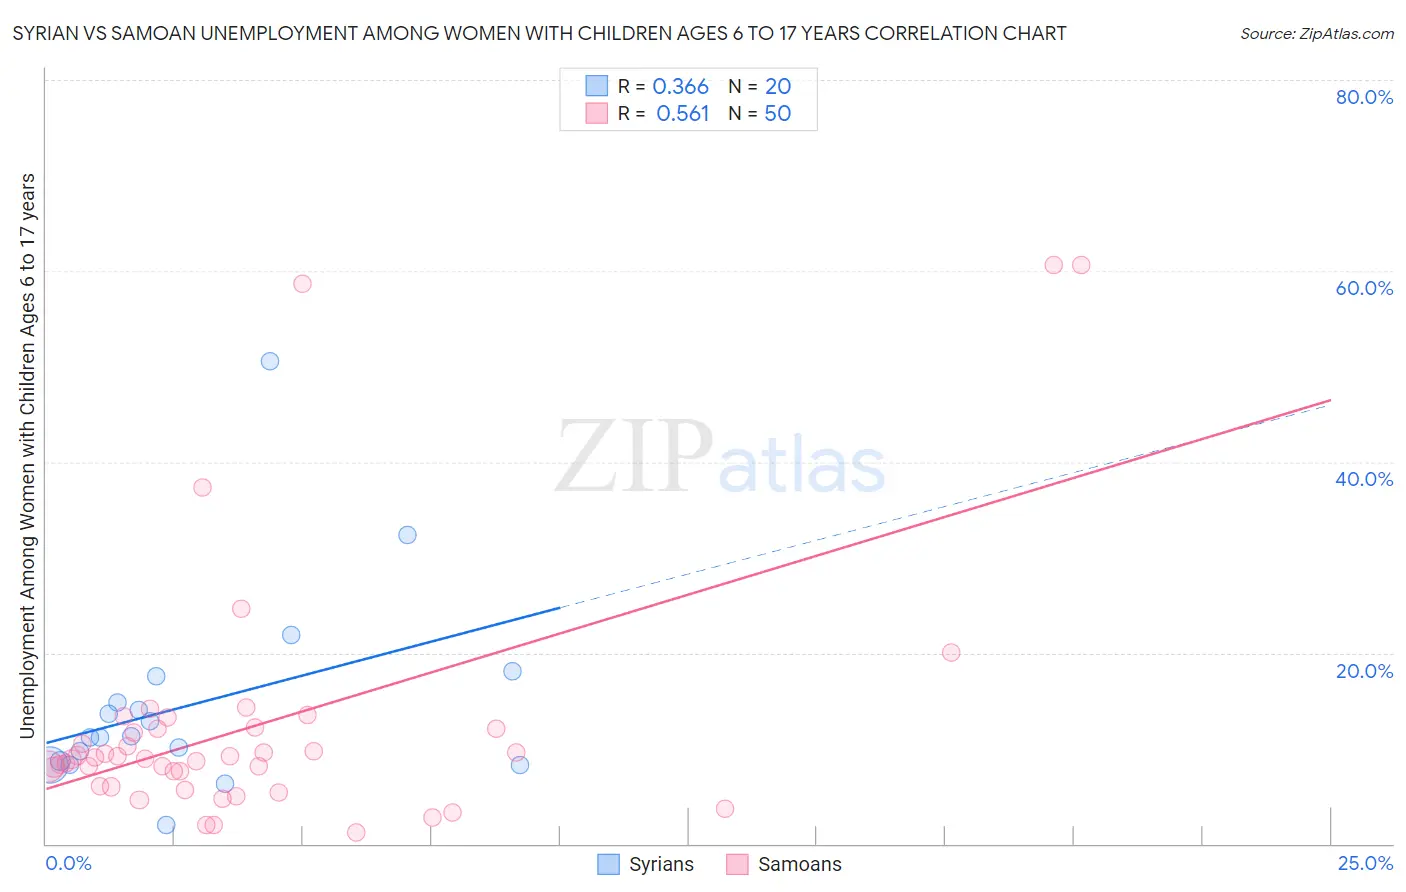
Syrian vs Samoan Unemployment Among Women with Children Ages 6 to 17 years Correlation Chart
The statistical analysis conducted on geographies consisting of 201,815,602 people shows a mild positive correlation between the proportion of Syrians and unemployment rate among women with children between the ages 6 and 17 in the United States with a correlation coefficient (R) of 0.366 and weighted average of 9.2%. Similarly, the statistical analysis conducted on geographies consisting of 183,981,110 people shows a substantial positive correlation between the proportion of Samoans and unemployment rate among women with children between the ages 6 and 17 in the United States with a correlation coefficient (R) of 0.561 and weighted average of 8.4%, a difference of 10.0%.
Unemployment Among Women with Children Ages 6 to 17 years Correlation Summary
| Measurement | Syrian | Samoan |
| Minimum | 2.0% | 1.2% |
| Maximum | 50.6% | 60.6% |
| Range | 48.6% | 59.4% |
| Mean | 14.5% | 12.5% |
| Median | 11.2% | 9.0% |
| Interquartile 25% (IQ1) | 8.5% | 6.0% |
| Interquartile 75% (IQ3) | 16.2% | 12.0% |
| Interquartile Range (IQR) | 7.7% | 6.0% |
| Standard Deviation (Sample) | 10.7% | 13.5% |
| Standard Deviation (Population) | 10.4% | 13.3% |
Similar Demographics by Unemployment Among Women with Children Ages 6 to 17 years
Demographics Similar to Syrians by Unemployment Among Women with Children Ages 6 to 17 years
In terms of unemployment among women with children ages 6 to 17 years, the demographic groups most similar to Syrians are German (9.2%, a difference of 0.050%), Immigrants from Scotland (9.2%, a difference of 0.050%), Immigrants from Germany (9.2%, a difference of 0.060%), Immigrants from Uruguay (9.2%, a difference of 0.060%), and Belgian (9.2%, a difference of 0.080%).
| Demographics | Rating | Rank | Unemployment Among Women with Children Ages 6 to 17 years |
| Immigrants | Cuba | 9.6 /100 | #211 | Tragic 9.2% |
| Peruvians | 9.0 /100 | #212 | Tragic 9.2% |
| Spaniards | 8.2 /100 | #213 | Tragic 9.2% |
| Iroquois | 7.5 /100 | #214 | Tragic 9.2% |
| Immigrants | Germany | 7.2 /100 | #215 | Tragic 9.2% |
| Immigrants | Uruguay | 7.2 /100 | #216 | Tragic 9.2% |
| Germans | 7.2 /100 | #217 | Tragic 9.2% |
| Syrians | 6.9 /100 | #218 | Tragic 9.2% |
| Immigrants | Scotland | 6.6 /100 | #219 | Tragic 9.2% |
| Belgians | 6.4 /100 | #220 | Tragic 9.2% |
| Crow | 5.8 /100 | #221 | Tragic 9.2% |
| Immigrants | Southern Europe | 5.8 /100 | #222 | Tragic 9.2% |
| Immigrants | Eritrea | 5.8 /100 | #223 | Tragic 9.2% |
| Immigrants | El Salvador | 5.3 /100 | #224 | Tragic 9.3% |
| Chinese | 5.2 /100 | #225 | Tragic 9.3% |
Demographics Similar to Samoans by Unemployment Among Women with Children Ages 6 to 17 years
In terms of unemployment among women with children ages 6 to 17 years, the demographic groups most similar to Samoans are Immigrants from Sri Lanka (8.4%, a difference of 0.080%), Immigrants from Moldova (8.4%, a difference of 0.11%), Iraqi (8.4%, a difference of 0.16%), Pakistani (8.4%, a difference of 0.29%), and Mongolian (8.4%, a difference of 0.30%).
| Demographics | Rating | Rank | Unemployment Among Women with Children Ages 6 to 17 years |
| Armenians | 99.9 /100 | #67 | Exceptional 8.3% |
| Marshallese | 99.9 /100 | #68 | Exceptional 8.3% |
| Immigrants | Thailand | 99.9 /100 | #69 | Exceptional 8.3% |
| Norwegians | 99.9 /100 | #70 | Exceptional 8.3% |
| Immigrants | Australia | 99.8 /100 | #71 | Exceptional 8.3% |
| Immigrants | Nepal | 99.8 /100 | #72 | Exceptional 8.3% |
| Spanish Americans | 99.8 /100 | #73 | Exceptional 8.4% |
| Samoans | 99.7 /100 | #74 | Exceptional 8.4% |
| Immigrants | Sri Lanka | 99.7 /100 | #75 | Exceptional 8.4% |
| Immigrants | Moldova | 99.7 /100 | #76 | Exceptional 8.4% |
| Iraqis | 99.7 /100 | #77 | Exceptional 8.4% |
| Pakistanis | 99.6 /100 | #78 | Exceptional 8.4% |
| Mongolians | 99.6 /100 | #79 | Exceptional 8.4% |
| Immigrants | Belarus | 99.6 /100 | #80 | Exceptional 8.4% |
| Immigrants | Bolivia | 99.6 /100 | #81 | Exceptional 8.4% |