Immigrants from Kuwait vs Japanese Female Disability
COMPARE
Immigrants from Kuwait
Japanese
Female Disability
Female Disability Comparison
Immigrants from Kuwait
Japanese
11.1%
FEMALE DISABILITY
100.0/ 100
METRIC RATING
31st/ 347
METRIC RANK
12.6%
FEMALE DISABILITY
2.7/ 100
METRIC RATING
241st/ 347
METRIC RANK
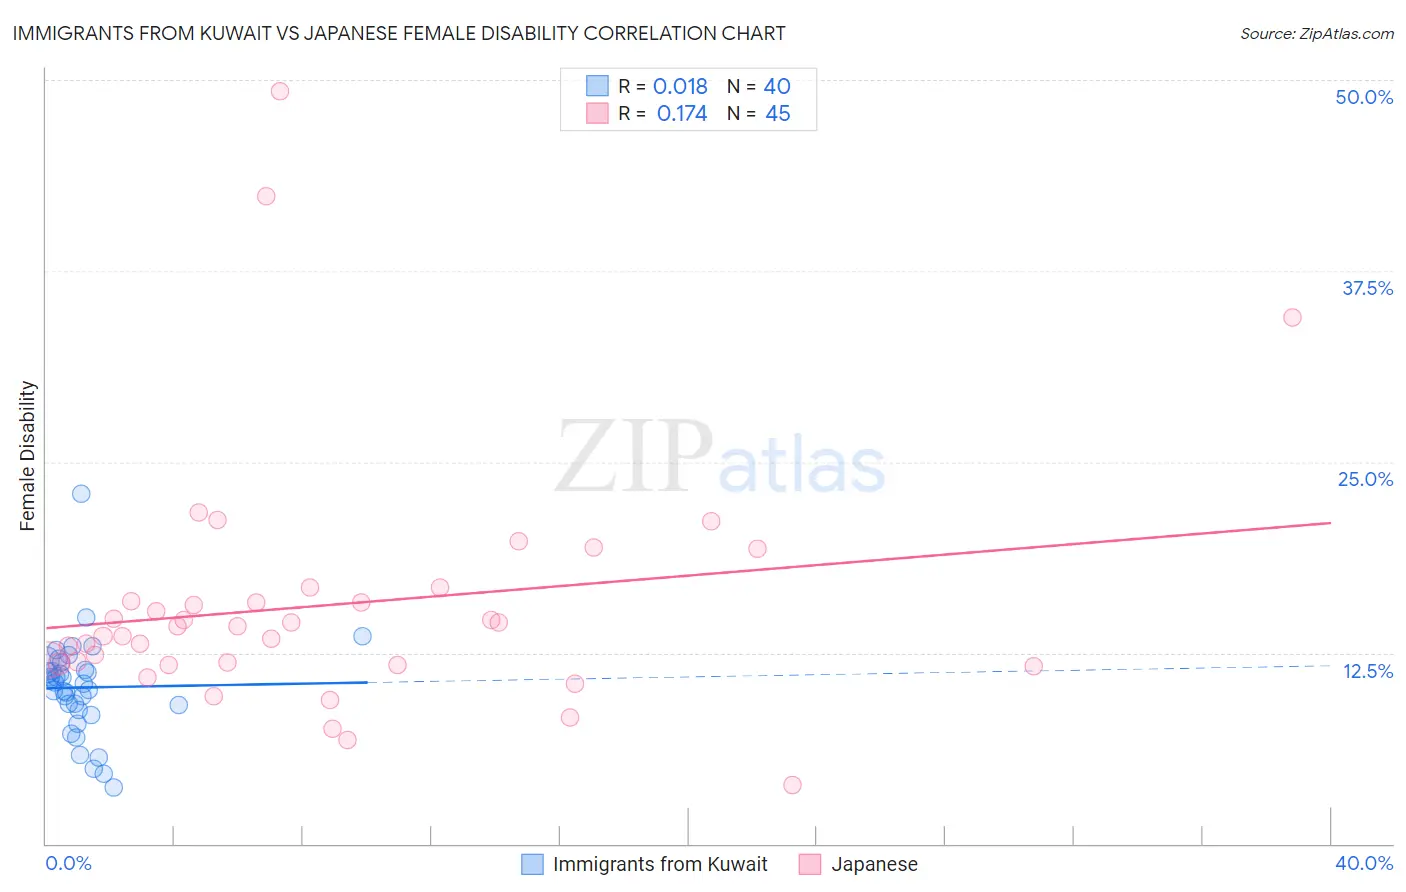
Immigrants from Kuwait vs Japanese Female Disability Correlation Chart
The statistical analysis conducted on geographies consisting of 136,914,007 people shows no correlation between the proportion of Immigrants from Kuwait and percentage of females with a disability in the United States with a correlation coefficient (R) of 0.018 and weighted average of 11.1%. Similarly, the statistical analysis conducted on geographies consisting of 249,148,020 people shows a poor positive correlation between the proportion of Japanese and percentage of females with a disability in the United States with a correlation coefficient (R) of 0.174 and weighted average of 12.6%, a difference of 13.4%.
Female Disability Correlation Summary
| Measurement | Immigrants from Kuwait | Japanese |
| Minimum | 3.7% | 3.8% |
| Maximum | 22.9% | 49.3% |
| Range | 19.3% | 45.4% |
| Mean | 10.2% | 15.6% |
| Median | 10.6% | 14.2% |
| Interquartile 25% (IQ1) | 8.9% | 11.8% |
| Interquartile 75% (IQ3) | 11.6% | 16.3% |
| Interquartile Range (IQR) | 2.7% | 4.6% |
| Standard Deviation (Sample) | 3.3% | 8.2% |
| Standard Deviation (Population) | 3.2% | 8.1% |
Similar Demographics by Female Disability
Demographics Similar to Immigrants from Kuwait by Female Disability
In terms of female disability, the demographic groups most similar to Immigrants from Kuwait are Immigrants from Malaysia (11.1%, a difference of 0.10%), Turkish (11.1%, a difference of 0.10%), Egyptian (11.1%, a difference of 0.17%), Immigrants from Australia (11.1%, a difference of 0.17%), and Immigrants from Egypt (11.1%, a difference of 0.25%).
| Demographics | Rating | Rank | Female Disability |
| Immigrants | Argentina | 100.0 /100 | #24 | Exceptional 11.0% |
| Immigrants | Asia | 100.0 /100 | #25 | Exceptional 11.0% |
| Argentineans | 100.0 /100 | #26 | Exceptional 11.0% |
| Immigrants | Turkey | 100.0 /100 | #27 | Exceptional 11.1% |
| Egyptians | 100.0 /100 | #28 | Exceptional 11.1% |
| Immigrants | Malaysia | 100.0 /100 | #29 | Exceptional 11.1% |
| Turks | 100.0 /100 | #30 | Exceptional 11.1% |
| Immigrants | Kuwait | 100.0 /100 | #31 | Exceptional 11.1% |
| Immigrants | Australia | 100.0 /100 | #32 | Exceptional 11.1% |
| Immigrants | Egypt | 100.0 /100 | #33 | Exceptional 11.1% |
| Immigrants | Indonesia | 100.0 /100 | #34 | Exceptional 11.2% |
| Immigrants | Japan | 100.0 /100 | #35 | Exceptional 11.2% |
| Cypriots | 100.0 /100 | #36 | Exceptional 11.2% |
| Ethiopians | 100.0 /100 | #37 | Exceptional 11.2% |
| Immigrants | Ethiopia | 100.0 /100 | #38 | Exceptional 11.2% |
Demographics Similar to Japanese by Female Disability
In terms of female disability, the demographic groups most similar to Japanese are Canadian (12.6%, a difference of 0.050%), Immigrants from Senegal (12.6%, a difference of 0.060%), Alsatian (12.6%, a difference of 0.070%), German Russian (12.6%, a difference of 0.17%), and Immigrants from Jamaica (12.6%, a difference of 0.21%).
| Demographics | Rating | Rank | Female Disability |
| Scandinavians | 5.3 /100 | #234 | Tragic 12.5% |
| Malaysians | 5.0 /100 | #235 | Tragic 12.5% |
| Immigrants | West Indies | 4.4 /100 | #236 | Tragic 12.6% |
| Slavs | 3.8 /100 | #237 | Tragic 12.6% |
| Yugoslavians | 3.7 /100 | #238 | Tragic 12.6% |
| Barbadians | 3.6 /100 | #239 | Tragic 12.6% |
| German Russians | 3.2 /100 | #240 | Tragic 12.6% |
| Japanese | 2.7 /100 | #241 | Tragic 12.6% |
| Canadians | 2.6 /100 | #242 | Tragic 12.6% |
| Immigrants | Senegal | 2.5 /100 | #243 | Tragic 12.6% |
| Alsatians | 2.5 /100 | #244 | Tragic 12.6% |
| Immigrants | Jamaica | 2.2 /100 | #245 | Tragic 12.6% |
| Spanish American Indians | 2.1 /100 | #246 | Tragic 12.6% |
| Menominee | 2.1 /100 | #247 | Tragic 12.6% |
| Carpatho Rusyns | 2.0 /100 | #248 | Tragic 12.6% |