Swiss vs Immigrants from Sudan Ambulatory Disability
COMPARE
Swiss
Immigrants from Sudan
Ambulatory Disability
Ambulatory Disability Comparison
Swiss
Immigrants from Sudan
6.1%
AMBULATORY DISABILITY
43.1/ 100
METRIC RATING
181st/ 347
METRIC RANK
5.8%
AMBULATORY DISABILITY
98.8/ 100
METRIC RATING
91st/ 347
METRIC RANK
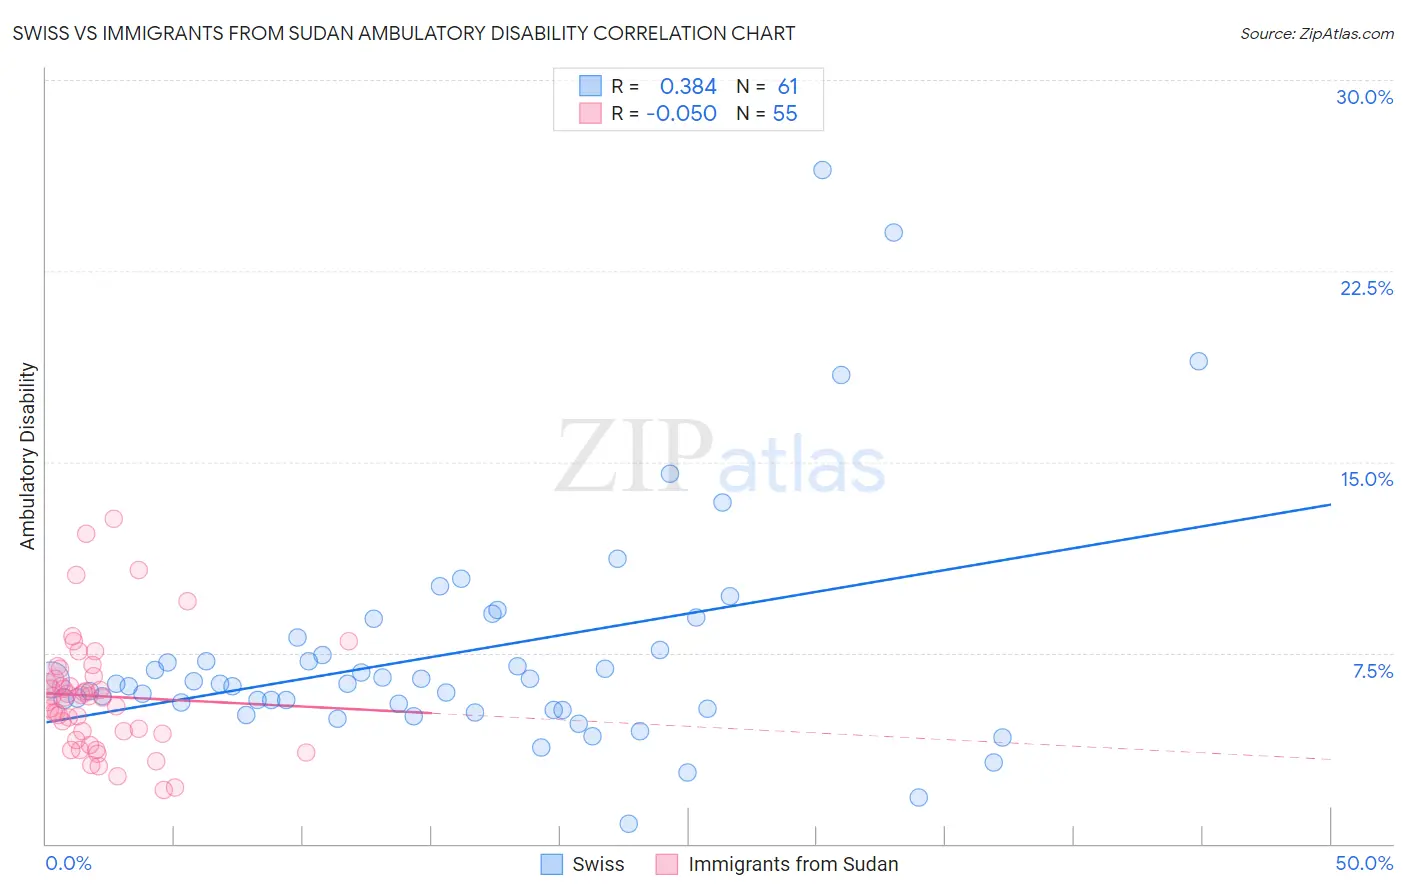
Swiss vs Immigrants from Sudan Ambulatory Disability Correlation Chart
The statistical analysis conducted on geographies consisting of 464,822,088 people shows a mild positive correlation between the proportion of Swiss and percentage of population with ambulatory disability in the United States with a correlation coefficient (R) of 0.384 and weighted average of 6.1%. Similarly, the statistical analysis conducted on geographies consisting of 118,955,409 people shows a slight negative correlation between the proportion of Immigrants from Sudan and percentage of population with ambulatory disability in the United States with a correlation coefficient (R) of -0.050 and weighted average of 5.8%, a difference of 6.6%.
Ambulatory Disability Correlation Summary
| Measurement | Swiss | Immigrants from Sudan |
| Minimum | 0.81% | 2.1% |
| Maximum | 26.5% | 12.8% |
| Range | 25.7% | 10.7% |
| Mean | 7.5% | 5.8% |
| Median | 6.3% | 5.7% |
| Interquartile 25% (IQ1) | 5.3% | 4.3% |
| Interquartile 75% (IQ3) | 7.8% | 6.6% |
| Interquartile Range (IQR) | 2.6% | 2.2% |
| Standard Deviation (Sample) | 4.6% | 2.3% |
| Standard Deviation (Population) | 4.6% | 2.2% |
Similar Demographics by Ambulatory Disability
Demographics Similar to Swiss by Ambulatory Disability
In terms of ambulatory disability, the demographic groups most similar to Swiss are Serbian (6.1%, a difference of 0.010%), Immigrants from Nicaragua (6.1%, a difference of 0.040%), Austrian (6.1%, a difference of 0.050%), Immigrants from Thailand (6.1%, a difference of 0.050%), and Scandinavian (6.1%, a difference of 0.080%).
| Demographics | Rating | Rank | Ambulatory Disability |
| Immigrants | Canada | 50.0 /100 | #174 | Average 6.1% |
| Vietnamese | 47.2 /100 | #175 | Average 6.1% |
| Immigrants | North America | 45.6 /100 | #176 | Average 6.1% |
| Immigrants | England | 45.4 /100 | #177 | Average 6.1% |
| Scandinavians | 44.5 /100 | #178 | Average 6.1% |
| Austrians | 44.1 /100 | #179 | Average 6.1% |
| Immigrants | Nicaragua | 43.9 /100 | #180 | Average 6.1% |
| Swiss | 43.1 /100 | #181 | Average 6.1% |
| Serbians | 42.8 /100 | #182 | Average 6.1% |
| Immigrants | Thailand | 42.2 /100 | #183 | Average 6.1% |
| Immigrants | Ghana | 41.2 /100 | #184 | Average 6.1% |
| Immigrants | Bosnia and Herzegovina | 37.2 /100 | #185 | Fair 6.2% |
| Europeans | 36.2 /100 | #186 | Fair 6.2% |
| Carpatho Rusyns | 35.3 /100 | #187 | Fair 6.2% |
| British | 34.3 /100 | #188 | Fair 6.2% |
Demographics Similar to Immigrants from Sudan by Ambulatory Disability
In terms of ambulatory disability, the demographic groups most similar to Immigrants from Sudan are Bhutanese (5.8%, a difference of 0.0%), Australian (5.8%, a difference of 0.0%), Soviet Union (5.8%, a difference of 0.12%), Immigrants from Chile (5.8%, a difference of 0.17%), and Immigrants from Sierra Leone (5.8%, a difference of 0.17%).
| Demographics | Rating | Rank | Ambulatory Disability |
| Ugandans | 99.2 /100 | #84 | Exceptional 5.7% |
| South Americans | 99.0 /100 | #85 | Exceptional 5.7% |
| Latvians | 99.0 /100 | #86 | Exceptional 5.7% |
| Immigrants | Chile | 98.9 /100 | #87 | Exceptional 5.8% |
| Soviet Union | 98.9 /100 | #88 | Exceptional 5.8% |
| Bhutanese | 98.8 /100 | #89 | Exceptional 5.8% |
| Australians | 98.8 /100 | #90 | Exceptional 5.8% |
| Immigrants | Sudan | 98.8 /100 | #91 | Exceptional 5.8% |
| Immigrants | Sierra Leone | 98.6 /100 | #92 | Exceptional 5.8% |
| Immigrants | Denmark | 98.6 /100 | #93 | Exceptional 5.8% |
| Kenyans | 98.4 /100 | #94 | Exceptional 5.8% |
| Immigrants | El Salvador | 98.4 /100 | #95 | Exceptional 5.8% |
| Salvadorans | 98.4 /100 | #96 | Exceptional 5.8% |
| Immigrants | Somalia | 98.3 /100 | #97 | Exceptional 5.8% |
| Immigrants | Lebanon | 98.3 /100 | #98 | Exceptional 5.8% |