Eastern European vs Immigrants from Syria Ambulatory Disability
COMPARE
Eastern European
Immigrants from Syria
Ambulatory Disability
Ambulatory Disability Comparison
Eastern Europeans
Immigrants from Syria
5.7%
AMBULATORY DISABILITY
99.2/ 100
METRIC RATING
83rd/ 347
METRIC RANK
6.0%
AMBULATORY DISABILITY
84.1/ 100
METRIC RATING
137th/ 347
METRIC RANK
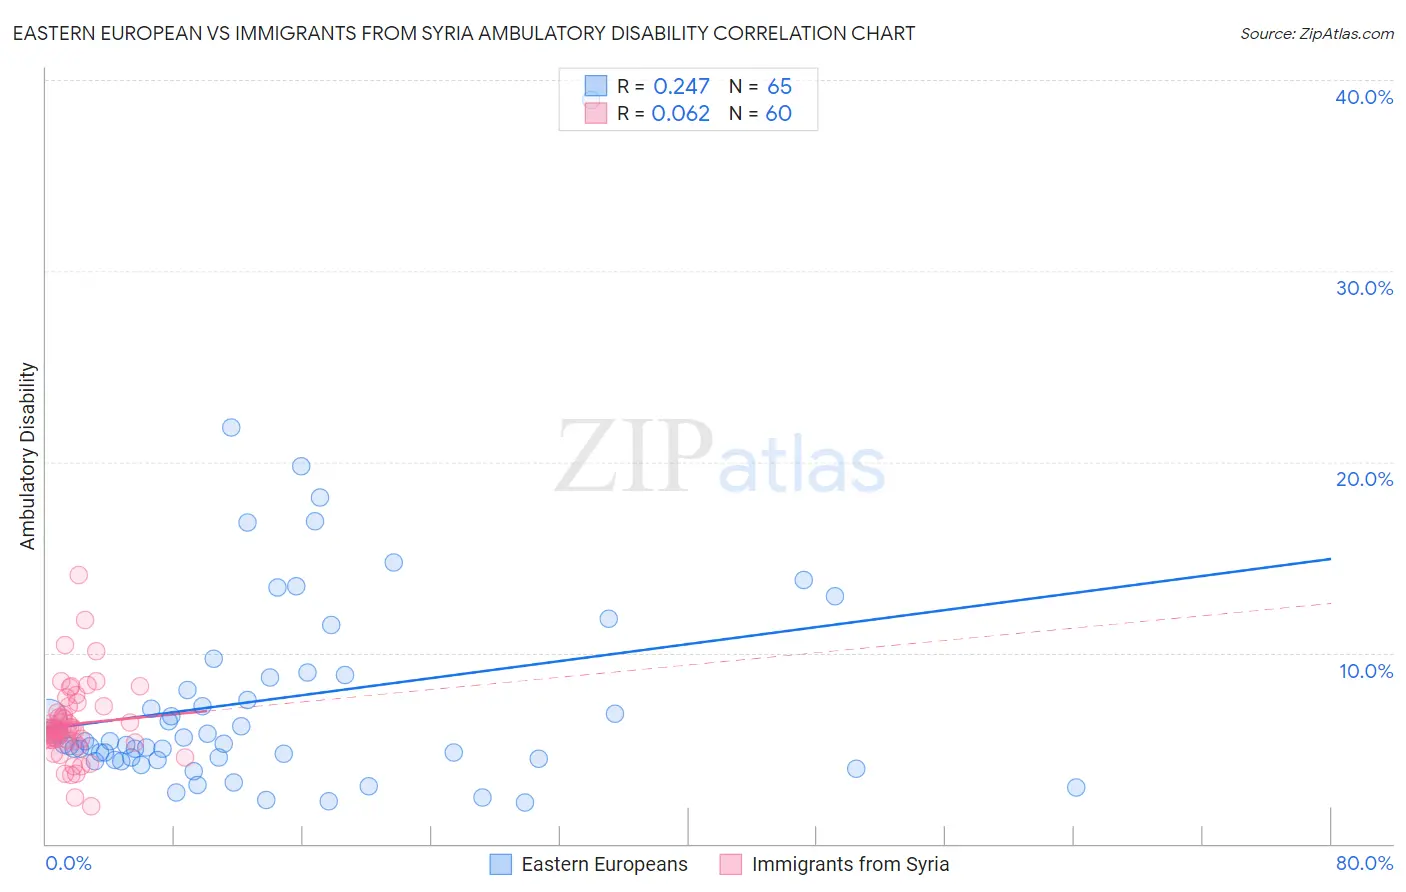
Eastern European vs Immigrants from Syria Ambulatory Disability Correlation Chart
The statistical analysis conducted on geographies consisting of 461,048,230 people shows a weak positive correlation between the proportion of Eastern Europeans and percentage of population with ambulatory disability in the United States with a correlation coefficient (R) of 0.247 and weighted average of 5.7%. Similarly, the statistical analysis conducted on geographies consisting of 174,106,838 people shows a slight positive correlation between the proportion of Immigrants from Syria and percentage of population with ambulatory disability in the United States with a correlation coefficient (R) of 0.062 and weighted average of 6.0%, a difference of 4.4%.
Ambulatory Disability Correlation Summary
| Measurement | Eastern European | Immigrants from Syria |
| Minimum | 2.2% | 1.9% |
| Maximum | 39.0% | 14.1% |
| Range | 36.8% | 12.1% |
| Mean | 7.6% | 6.3% |
| Median | 5.3% | 6.0% |
| Interquartile 25% (IQ1) | 4.4% | 5.4% |
| Interquartile 75% (IQ3) | 8.8% | 7.0% |
| Interquartile Range (IQR) | 4.4% | 1.6% |
| Standard Deviation (Sample) | 6.0% | 2.0% |
| Standard Deviation (Population) | 5.9% | 2.0% |
Similar Demographics by Ambulatory Disability
Demographics Similar to Eastern Europeans by Ambulatory Disability
In terms of ambulatory disability, the demographic groups most similar to Eastern Europeans are Ugandan (5.7%, a difference of 0.0%), Immigrants from Jordan (5.7%, a difference of 0.020%), Palestinian (5.7%, a difference of 0.020%), Immigrants from Ireland (5.7%, a difference of 0.030%), and Chilean (5.7%, a difference of 0.16%).
| Demographics | Rating | Rank | Ambulatory Disability |
| Sudanese | 99.3 /100 | #76 | Exceptional 5.7% |
| Immigrants | Vietnam | 99.3 /100 | #77 | Exceptional 5.7% |
| Somalis | 99.2 /100 | #78 | Exceptional 5.7% |
| Chileans | 99.2 /100 | #79 | Exceptional 5.7% |
| Immigrants | Ireland | 99.2 /100 | #80 | Exceptional 5.7% |
| Immigrants | Jordan | 99.2 /100 | #81 | Exceptional 5.7% |
| Palestinians | 99.2 /100 | #82 | Exceptional 5.7% |
| Eastern Europeans | 99.2 /100 | #83 | Exceptional 5.7% |
| Ugandans | 99.2 /100 | #84 | Exceptional 5.7% |
| South Americans | 99.0 /100 | #85 | Exceptional 5.7% |
| Latvians | 99.0 /100 | #86 | Exceptional 5.7% |
| Immigrants | Chile | 98.9 /100 | #87 | Exceptional 5.8% |
| Soviet Union | 98.9 /100 | #88 | Exceptional 5.8% |
| Bhutanese | 98.8 /100 | #89 | Exceptional 5.8% |
| Australians | 98.8 /100 | #90 | Exceptional 5.8% |
Demographics Similar to Immigrants from Syria by Ambulatory Disability
In terms of ambulatory disability, the demographic groups most similar to Immigrants from Syria are Immigrants from North Macedonia (6.0%, a difference of 0.0%), Immigrants from Hungary (6.0%, a difference of 0.020%), Immigrants from Zaire (6.0%, a difference of 0.050%), Czech (6.0%, a difference of 0.080%), and Immigrants from Italy (6.0%, a difference of 0.090%).
| Demographics | Rating | Rank | Ambulatory Disability |
| Immigrants | Kazakhstan | 89.7 /100 | #130 | Excellent 5.9% |
| Immigrants | Costa Rica | 89.5 /100 | #131 | Excellent 5.9% |
| Immigrants | Europe | 87.8 /100 | #132 | Excellent 6.0% |
| Immigrants | Immigrants | 86.9 /100 | #133 | Excellent 6.0% |
| Ute | 86.6 /100 | #134 | Excellent 6.0% |
| Immigrants | Italy | 85.0 /100 | #135 | Excellent 6.0% |
| Immigrants | North Macedonia | 84.1 /100 | #136 | Excellent 6.0% |
| Immigrants | Syria | 84.1 /100 | #137 | Excellent 6.0% |
| Immigrants | Hungary | 83.9 /100 | #138 | Excellent 6.0% |
| Immigrants | Zaire | 83.6 /100 | #139 | Excellent 6.0% |
| Czechs | 83.3 /100 | #140 | Excellent 6.0% |
| Swedes | 83.1 /100 | #141 | Excellent 6.0% |
| Immigrants | Philippines | 83.0 /100 | #142 | Excellent 6.0% |
| Romanians | 82.9 /100 | #143 | Excellent 6.0% |
| Macedonians | 82.8 /100 | #144 | Excellent 6.0% |