Swiss vs Immigrants from Jamaica 6th Grade
COMPARE
Swiss
Immigrants from Jamaica
6th Grade
6th Grade Comparison
Swiss
Immigrants from Jamaica
97.9%
6TH GRADE
100.0/ 100
METRIC RATING
34th/ 347
METRIC RANK
96.4%
6TH GRADE
0.2/ 100
METRIC RATING
265th/ 347
METRIC RANK
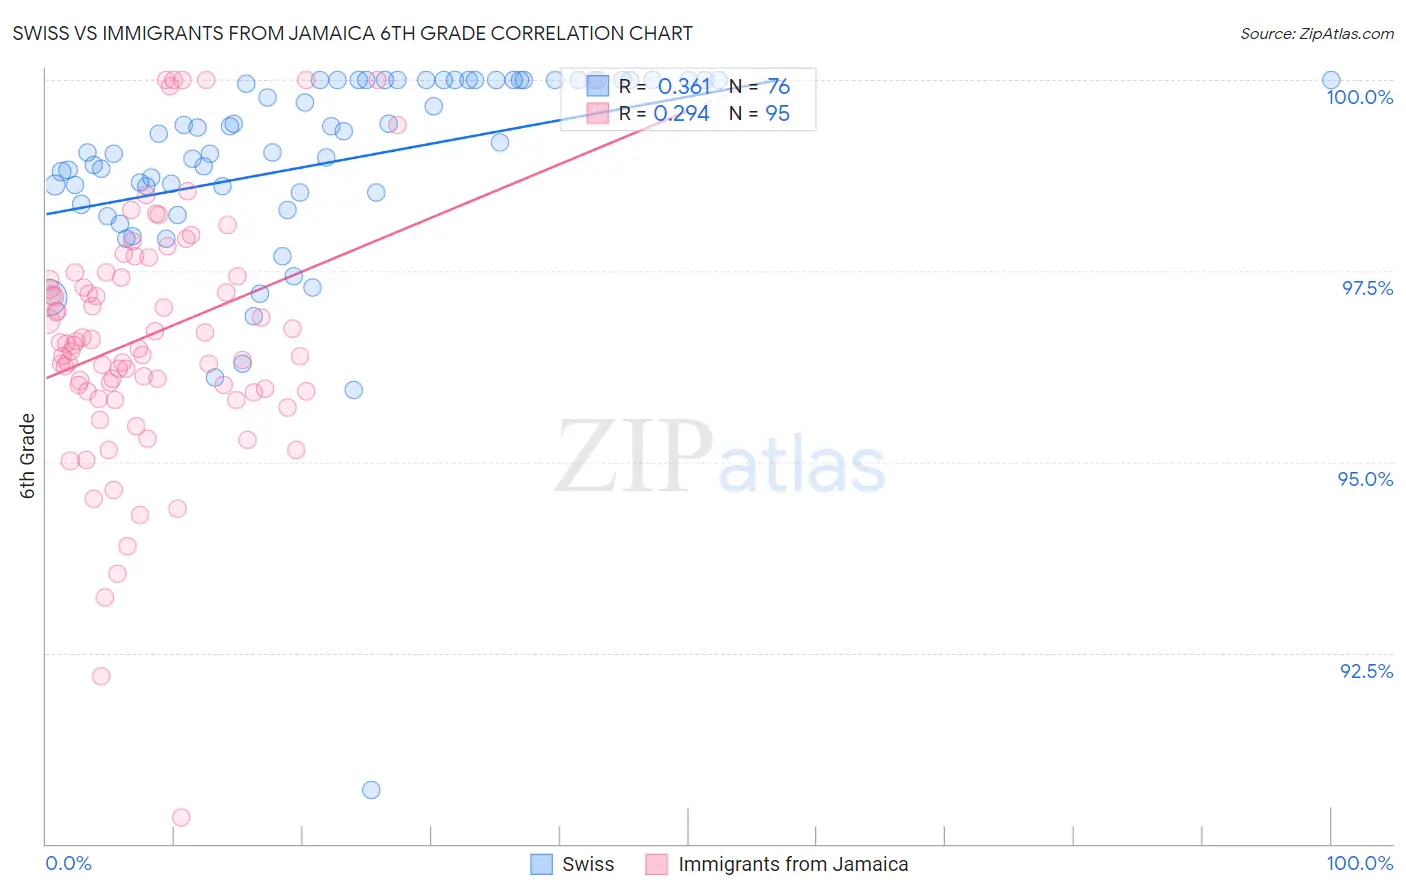
Swiss vs Immigrants from Jamaica 6th Grade Correlation Chart
The statistical analysis conducted on geographies consisting of 465,021,856 people shows a mild positive correlation between the proportion of Swiss and percentage of population with at least 6th grade education in the United States with a correlation coefficient (R) of 0.361 and weighted average of 97.9%. Similarly, the statistical analysis conducted on geographies consisting of 301,829,550 people shows a weak positive correlation between the proportion of Immigrants from Jamaica and percentage of population with at least 6th grade education in the United States with a correlation coefficient (R) of 0.294 and weighted average of 96.4%, a difference of 1.6%.
6th Grade Correlation Summary
| Measurement | Swiss | Immigrants from Jamaica |
| Minimum | 90.7% | 90.4% |
| Maximum | 100.0% | 100.0% |
| Range | 9.3% | 9.6% |
| Mean | 98.9% | 96.7% |
| Median | 99.1% | 96.6% |
| Interquartile 25% (IQ1) | 98.5% | 95.9% |
| Interquartile 75% (IQ3) | 100.0% | 97.5% |
| Interquartile Range (IQR) | 1.5% | 1.5% |
| Standard Deviation (Sample) | 1.4% | 1.7% |
| Standard Deviation (Population) | 1.4% | 1.7% |
Similar Demographics by 6th Grade
Demographics Similar to Swiss by 6th Grade
In terms of 6th grade, the demographic groups most similar to Swiss are Chippewa (97.9%, a difference of 0.0%), Chinese (97.9%, a difference of 0.020%), Italian (97.9%, a difference of 0.030%), British (97.9%, a difference of 0.030%), and Alaska Native (98.0%, a difference of 0.040%).
| Demographics | Rating | Rank | 6th Grade |
| Yup'ik | 100.0 /100 | #27 | Exceptional 98.0% |
| Scandinavians | 100.0 /100 | #28 | Exceptional 98.0% |
| French | 100.0 /100 | #29 | Exceptional 98.0% |
| French Canadians | 100.0 /100 | #30 | Exceptional 98.0% |
| Europeans | 100.0 /100 | #31 | Exceptional 98.0% |
| Alaska Natives | 100.0 /100 | #32 | Exceptional 98.0% |
| Chippewa | 100.0 /100 | #33 | Exceptional 97.9% |
| Swiss | 100.0 /100 | #34 | Exceptional 97.9% |
| Chinese | 100.0 /100 | #35 | Exceptional 97.9% |
| Italians | 100.0 /100 | #36 | Exceptional 97.9% |
| British | 100.0 /100 | #37 | Exceptional 97.9% |
| Belgians | 100.0 /100 | #38 | Exceptional 97.9% |
| Luxembourgers | 99.9 /100 | #39 | Exceptional 97.9% |
| Latvians | 99.9 /100 | #40 | Exceptional 97.9% |
| Eastern Europeans | 99.9 /100 | #41 | Exceptional 97.9% |
Demographics Similar to Immigrants from Jamaica by 6th Grade
In terms of 6th grade, the demographic groups most similar to Immigrants from Jamaica are Immigrants from Colombia (96.4%, a difference of 0.010%), Armenian (96.4%, a difference of 0.010%), Ghanaian (96.4%, a difference of 0.010%), Afghan (96.4%, a difference of 0.010%), and Immigrants from Nigeria (96.4%, a difference of 0.020%).
| Demographics | Rating | Rank | 6th Grade |
| Immigrants | China | 0.4 /100 | #258 | Tragic 96.4% |
| South Americans | 0.4 /100 | #259 | Tragic 96.4% |
| Peruvians | 0.4 /100 | #260 | Tragic 96.4% |
| Immigrants | Sierra Leone | 0.4 /100 | #261 | Tragic 96.4% |
| Immigrants | Nigeria | 0.3 /100 | #262 | Tragic 96.4% |
| Immigrants | Colombia | 0.3 /100 | #263 | Tragic 96.4% |
| Armenians | 0.3 /100 | #264 | Tragic 96.4% |
| Immigrants | Jamaica | 0.2 /100 | #265 | Tragic 96.4% |
| Ghanaians | 0.2 /100 | #266 | Tragic 96.4% |
| Afghans | 0.2 /100 | #267 | Tragic 96.4% |
| Immigrants | Uzbekistan | 0.2 /100 | #268 | Tragic 96.3% |
| West Indians | 0.2 /100 | #269 | Tragic 96.3% |
| Immigrants | South America | 0.2 /100 | #270 | Tragic 96.3% |
| Immigrants | Hong Kong | 0.2 /100 | #271 | Tragic 96.3% |
| Immigrants | Bolivia | 0.1 /100 | #272 | Tragic 96.3% |