Arab vs South African Vision Disability
COMPARE
Arab
South African
Vision Disability
Vision Disability Comparison
Arabs
South Africans
2.1%
VISION DISABILITY
86.3/ 100
METRIC RATING
138th/ 347
METRIC RANK
2.1%
VISION DISABILITY
69.8/ 100
METRIC RATING
159th/ 347
METRIC RANK
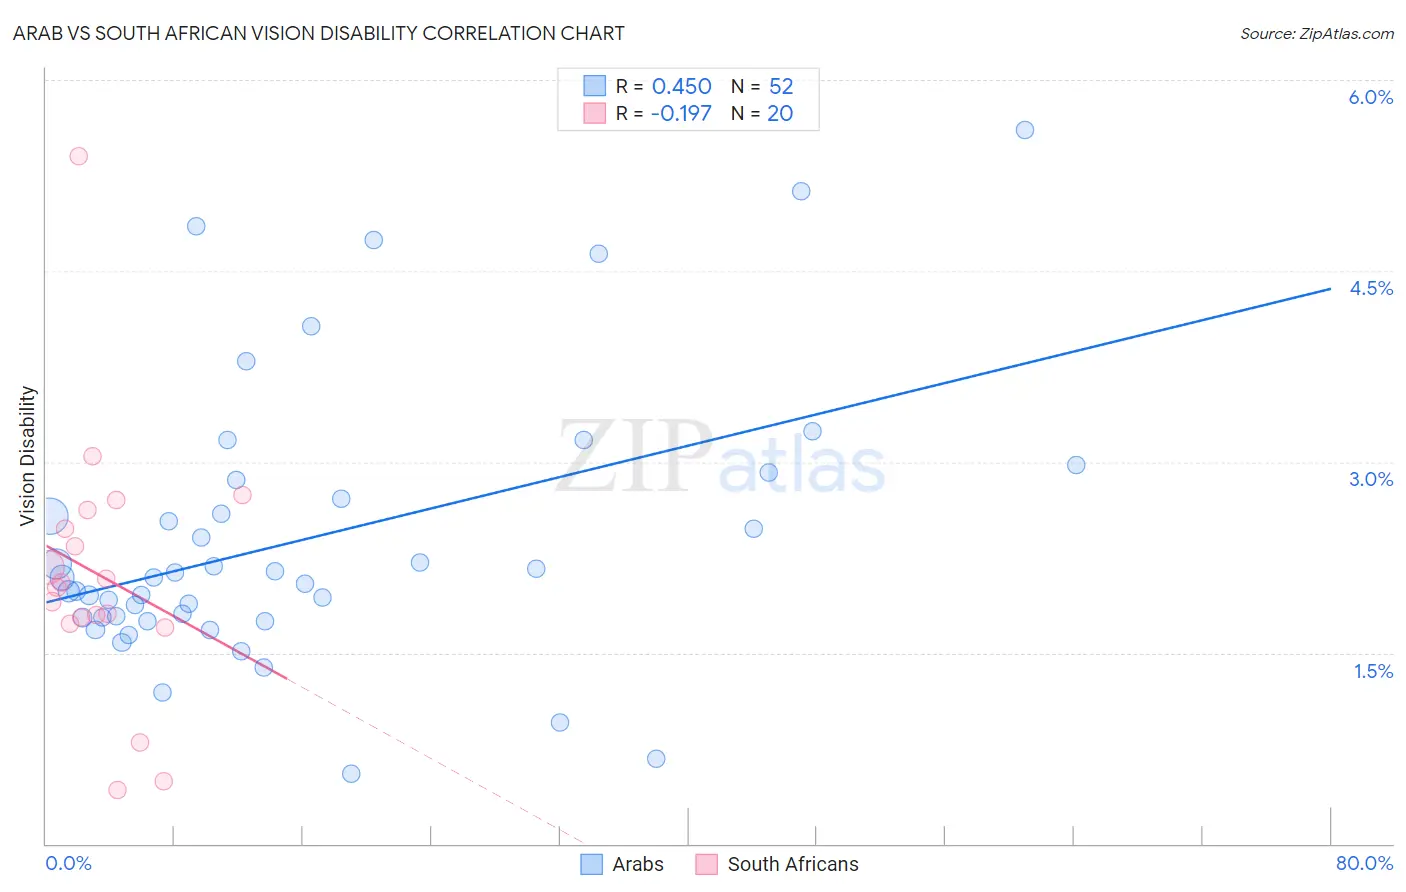
Arab vs South African Vision Disability Correlation Chart
The statistical analysis conducted on geographies consisting of 486,276,128 people shows a moderate positive correlation between the proportion of Arabs and percentage of population with vision disability in the United States with a correlation coefficient (R) of 0.450 and weighted average of 2.1%. Similarly, the statistical analysis conducted on geographies consisting of 182,556,547 people shows a poor negative correlation between the proportion of South Africans and percentage of population with vision disability in the United States with a correlation coefficient (R) of -0.197 and weighted average of 2.1%, a difference of 1.6%.
Vision Disability Correlation Summary
| Measurement | Arab | South African |
| Minimum | 0.55% | 0.42% |
| Maximum | 5.6% | 5.4% |
| Range | 5.1% | 5.0% |
| Mean | 2.4% | 2.1% |
| Median | 2.1% | 2.0% |
| Interquartile 25% (IQ1) | 1.8% | 1.8% |
| Interquartile 75% (IQ3) | 2.8% | 2.6% |
| Interquartile Range (IQR) | 1.0% | 0.79% |
| Standard Deviation (Sample) | 1.1% | 1.0% |
| Standard Deviation (Population) | 1.1% | 1.0% |
Similar Demographics by Vision Disability
Demographics Similar to Arabs by Vision Disability
In terms of vision disability, the demographic groups most similar to Arabs are Czech (2.1%, a difference of 0.010%), Immigrants from South Eastern Asia (2.1%, a difference of 0.010%), Vietnamese (2.1%, a difference of 0.060%), Venezuelan (2.1%, a difference of 0.13%), and Immigrants from Morocco (2.1%, a difference of 0.14%).
| Demographics | Rating | Rank | Vision Disability |
| Immigrants | Hungary | 88.7 /100 | #131 | Excellent 2.1% |
| New Zealanders | 88.2 /100 | #132 | Excellent 2.1% |
| Syrians | 87.5 /100 | #133 | Excellent 2.1% |
| Venezuelans | 87.2 /100 | #134 | Excellent 2.1% |
| Vietnamese | 86.7 /100 | #135 | Excellent 2.1% |
| Czechs | 86.3 /100 | #136 | Excellent 2.1% |
| Immigrants | South Eastern Asia | 86.3 /100 | #137 | Excellent 2.1% |
| Arabs | 86.3 /100 | #138 | Excellent 2.1% |
| Immigrants | Morocco | 85.2 /100 | #139 | Excellent 2.1% |
| Immigrants | Netherlands | 84.2 /100 | #140 | Excellent 2.1% |
| Sierra Leoneans | 84.1 /100 | #141 | Excellent 2.1% |
| South Americans | 82.8 /100 | #142 | Excellent 2.1% |
| Immigrants | Sierra Leone | 82.8 /100 | #143 | Excellent 2.1% |
| Ukrainians | 81.9 /100 | #144 | Excellent 2.1% |
| Immigrants | Bosnia and Herzegovina | 81.5 /100 | #145 | Excellent 2.1% |
Demographics Similar to South Africans by Vision Disability
In terms of vision disability, the demographic groups most similar to South Africans are Immigrants from Uzbekistan (2.1%, a difference of 0.010%), Serbian (2.1%, a difference of 0.030%), Austrian (2.1%, a difference of 0.060%), Pakistani (2.1%, a difference of 0.14%), and Iraqi (2.1%, a difference of 0.15%).
| Demographics | Rating | Rank | Vision Disability |
| Immigrants | Southern Europe | 74.6 /100 | #152 | Good 2.1% |
| Immigrants | South America | 73.8 /100 | #153 | Good 2.1% |
| Slovenes | 73.6 /100 | #154 | Good 2.1% |
| Immigrants | Colombia | 72.1 /100 | #155 | Good 2.1% |
| Pakistanis | 71.6 /100 | #156 | Good 2.1% |
| Serbians | 70.2 /100 | #157 | Good 2.1% |
| Immigrants | Uzbekistan | 69.9 /100 | #158 | Good 2.1% |
| South Africans | 69.8 /100 | #159 | Good 2.1% |
| Austrians | 69.0 /100 | #160 | Good 2.1% |
| Iraqis | 67.7 /100 | #161 | Good 2.1% |
| Hungarians | 67.4 /100 | #162 | Good 2.1% |
| Icelanders | 66.1 /100 | #163 | Good 2.1% |
| Immigrants | Bangladesh | 65.5 /100 | #164 | Good 2.1% |
| Immigrants | Iraq | 64.8 /100 | #165 | Good 2.1% |
| Immigrants | England | 62.8 /100 | #166 | Good 2.1% |