Swedish vs Nigerian Female Poverty Among 25-34 Year Olds
COMPARE
Swedish
Nigerian
Female Poverty Among 25-34 Year Olds
Female Poverty Among 25-34 Year Olds Comparison
Swedes
Nigerians
12.7%
FEMALE POVERTY AMONG 25-34 YEAR OLDS
95.4/ 100
METRIC RATING
104th/ 347
METRIC RANK
14.4%
FEMALE POVERTY AMONG 25-34 YEAR OLDS
4.2/ 100
METRIC RATING
223rd/ 347
METRIC RANK
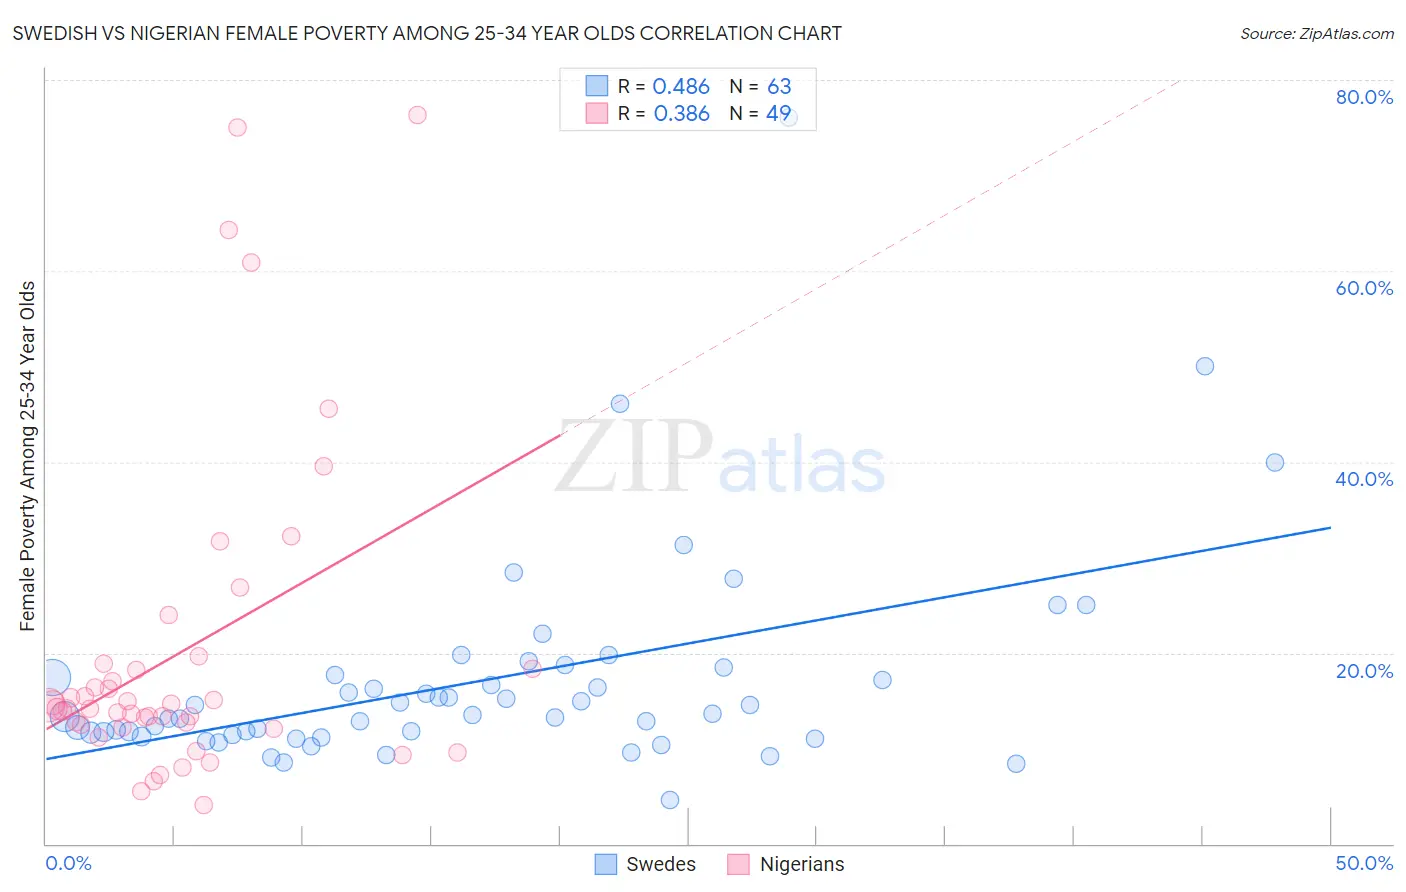
Swedish vs Nigerian Female Poverty Among 25-34 Year Olds Correlation Chart
The statistical analysis conducted on geographies consisting of 520,171,676 people shows a moderate positive correlation between the proportion of Swedes and poverty level among females between the ages 25 and 34 in the United States with a correlation coefficient (R) of 0.486 and weighted average of 12.7%. Similarly, the statistical analysis conducted on geographies consisting of 329,631,397 people shows a mild positive correlation between the proportion of Nigerians and poverty level among females between the ages 25 and 34 in the United States with a correlation coefficient (R) of 0.386 and weighted average of 14.4%, a difference of 13.7%.
Female Poverty Among 25-34 Year Olds Correlation Summary
| Measurement | Swedish | Nigerian |
| Minimum | 4.6% | 4.0% |
| Maximum | 76.1% | 76.3% |
| Range | 71.5% | 72.3% |
| Mean | 17.0% | 20.1% |
| Median | 13.4% | 14.2% |
| Interquartile 25% (IQ1) | 11.3% | 12.3% |
| Interquartile 75% (IQ3) | 17.7% | 18.6% |
| Interquartile Range (IQR) | 6.3% | 6.2% |
| Standard Deviation (Sample) | 11.3% | 16.8% |
| Standard Deviation (Population) | 11.2% | 16.7% |
Similar Demographics by Female Poverty Among 25-34 Year Olds
Demographics Similar to Swedes by Female Poverty Among 25-34 Year Olds
In terms of female poverty among 25-34 year olds, the demographic groups most similar to Swedes are Immigrants from Spain (12.7%, a difference of 0.050%), Immigrants from South Africa (12.7%, a difference of 0.050%), Peruvian (12.7%, a difference of 0.11%), Tsimshian (12.7%, a difference of 0.15%), and Immigrants from Switzerland (12.7%, a difference of 0.17%).
| Demographics | Rating | Rank | Female Poverty Among 25-34 Year Olds |
| Immigrants | Northern Africa | 96.6 /100 | #97 | Exceptional 12.6% |
| Immigrants | Ethiopia | 96.5 /100 | #98 | Exceptional 12.6% |
| Immigrants | Argentina | 96.4 /100 | #99 | Exceptional 12.6% |
| Immigrants | Denmark | 95.7 /100 | #100 | Exceptional 12.7% |
| Immigrants | Switzerland | 95.7 /100 | #101 | Exceptional 12.7% |
| Peruvians | 95.6 /100 | #102 | Exceptional 12.7% |
| Immigrants | Spain | 95.5 /100 | #103 | Exceptional 12.7% |
| Swedes | 95.4 /100 | #104 | Exceptional 12.7% |
| Immigrants | South Africa | 95.3 /100 | #105 | Exceptional 12.7% |
| Tsimshian | 95.1 /100 | #106 | Exceptional 12.7% |
| Poles | 94.9 /100 | #107 | Exceptional 12.7% |
| Immigrants | Norway | 94.4 /100 | #108 | Exceptional 12.7% |
| Immigrants | Peru | 94.3 /100 | #109 | Exceptional 12.7% |
| Australians | 94.1 /100 | #110 | Exceptional 12.8% |
| Danes | 93.9 /100 | #111 | Exceptional 12.8% |
Demographics Similar to Nigerians by Female Poverty Among 25-34 Year Olds
In terms of female poverty among 25-34 year olds, the demographic groups most similar to Nigerians are Immigrants from Portugal (14.4%, a difference of 0.060%), Immigrants from Sudan (14.4%, a difference of 0.070%), Sudanese (14.4%, a difference of 0.13%), Ghanaian (14.4%, a difference of 0.29%), and Immigrants from Barbados (14.5%, a difference of 0.39%).
| Demographics | Rating | Rank | Female Poverty Among 25-34 Year Olds |
| French Canadians | 5.5 /100 | #216 | Tragic 14.3% |
| Spanish American Indians | 5.5 /100 | #217 | Tragic 14.3% |
| Immigrants | Thailand | 5.2 /100 | #218 | Tragic 14.3% |
| Ecuadorians | 5.2 /100 | #219 | Tragic 14.3% |
| Ghanaians | 4.8 /100 | #220 | Tragic 14.4% |
| Sudanese | 4.4 /100 | #221 | Tragic 14.4% |
| Immigrants | Portugal | 4.3 /100 | #222 | Tragic 14.4% |
| Nigerians | 4.2 /100 | #223 | Tragic 14.4% |
| Immigrants | Sudan | 4.0 /100 | #224 | Tragic 14.4% |
| Immigrants | Barbados | 3.4 /100 | #225 | Tragic 14.5% |
| Nicaraguans | 3.3 /100 | #226 | Tragic 14.5% |
| Celtics | 2.8 /100 | #227 | Tragic 14.5% |
| Vietnamese | 2.6 /100 | #228 | Tragic 14.6% |
| Spanish | 2.5 /100 | #229 | Tragic 14.6% |
| Spaniards | 2.3 /100 | #230 | Tragic 14.6% |