Immigrants from Afghanistan vs Immigrants from Mexico Vision Disability
COMPARE
Immigrants from Afghanistan
Immigrants from Mexico
Vision Disability
Vision Disability Comparison
Immigrants from Afghanistan
Immigrants from Mexico
2.1%
VISION DISABILITY
95.6/ 100
METRIC RATING
97th/ 347
METRIC RANK
2.5%
VISION DISABILITY
0.0/ 100
METRIC RATING
296th/ 347
METRIC RANK
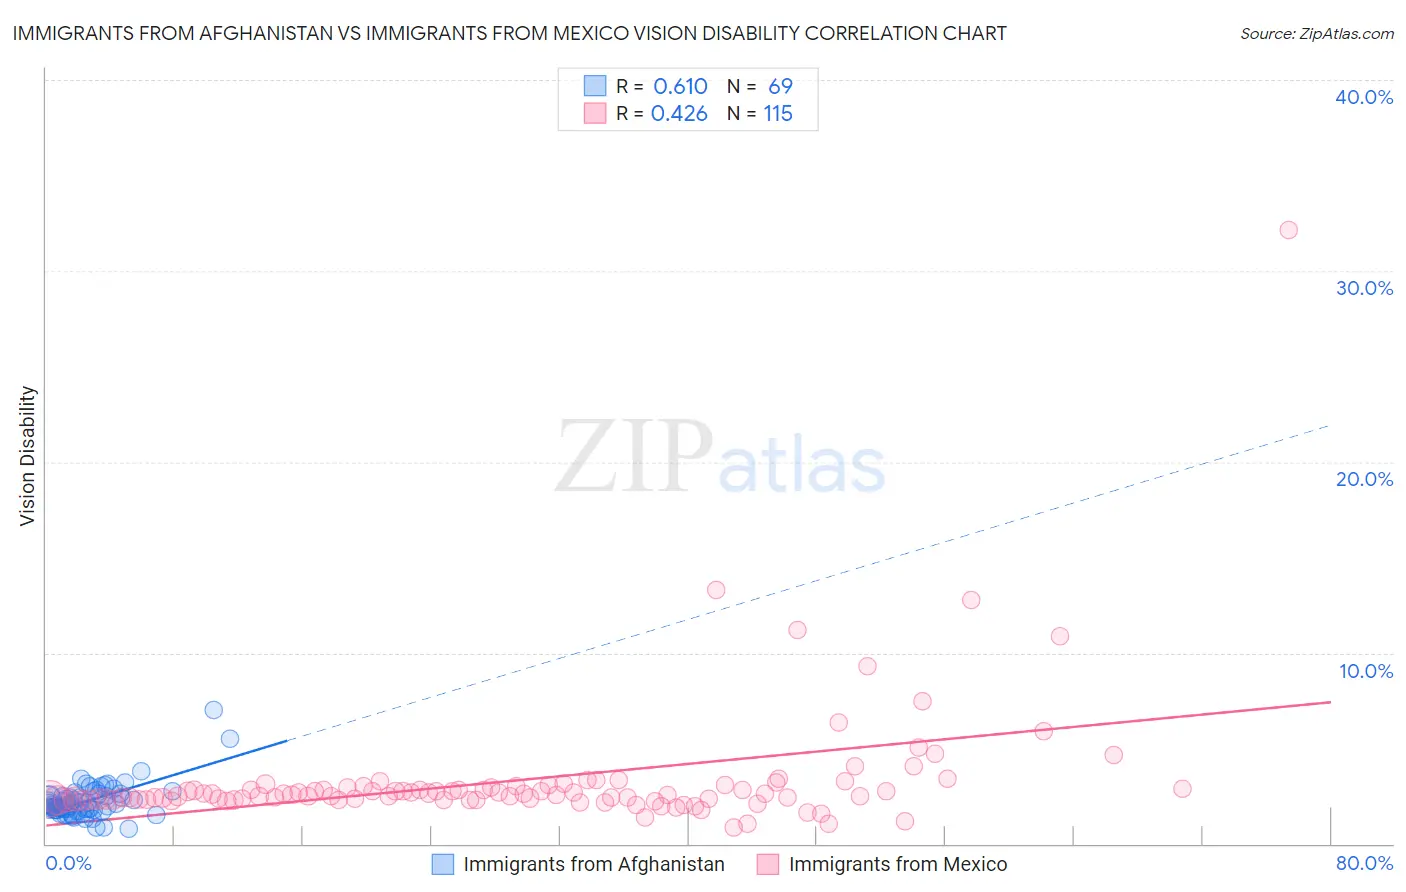
Immigrants from Afghanistan vs Immigrants from Mexico Vision Disability Correlation Chart
The statistical analysis conducted on geographies consisting of 147,616,042 people shows a significant positive correlation between the proportion of Immigrants from Afghanistan and percentage of population with vision disability in the United States with a correlation coefficient (R) of 0.610 and weighted average of 2.1%. Similarly, the statistical analysis conducted on geographies consisting of 512,775,331 people shows a moderate positive correlation between the proportion of Immigrants from Mexico and percentage of population with vision disability in the United States with a correlation coefficient (R) of 0.426 and weighted average of 2.5%, a difference of 21.9%.
Vision Disability Correlation Summary
| Measurement | Immigrants from Afghanistan | Immigrants from Mexico |
| Minimum | 0.79% | 0.88% |
| Maximum | 7.0% | 32.1% |
| Range | 6.2% | 31.3% |
| Mean | 2.2% | 3.3% |
| Median | 2.0% | 2.6% |
| Interquartile 25% (IQ1) | 1.8% | 2.3% |
| Interquartile 75% (IQ3) | 2.6% | 3.0% |
| Interquartile Range (IQR) | 0.84% | 0.66% |
| Standard Deviation (Sample) | 0.93% | 3.4% |
| Standard Deviation (Population) | 0.93% | 3.4% |
Similar Demographics by Vision Disability
Demographics Similar to Immigrants from Afghanistan by Vision Disability
In terms of vision disability, the demographic groups most similar to Immigrants from Afghanistan are Immigrants from South Africa (2.1%, a difference of 0.050%), Romanian (2.1%, a difference of 0.070%), Estonian (2.1%, a difference of 0.12%), Australian (2.1%, a difference of 0.13%), and Greek (2.1%, a difference of 0.16%).
| Demographics | Rating | Rank | Vision Disability |
| Immigrants | Lebanon | 96.7 /100 | #90 | Exceptional 2.1% |
| Immigrants | Somalia | 96.2 /100 | #91 | Exceptional 2.1% |
| Immigrants | Syria | 96.2 /100 | #92 | Exceptional 2.1% |
| Immigrants | Europe | 96.1 /100 | #93 | Exceptional 2.1% |
| Immigrants | Croatia | 96.0 /100 | #94 | Exceptional 2.1% |
| Australians | 95.9 /100 | #95 | Exceptional 2.1% |
| Romanians | 95.7 /100 | #96 | Exceptional 2.1% |
| Immigrants | Afghanistan | 95.6 /100 | #97 | Exceptional 2.1% |
| Immigrants | South Africa | 95.4 /100 | #98 | Exceptional 2.1% |
| Estonians | 95.3 /100 | #99 | Exceptional 2.1% |
| Greeks | 95.1 /100 | #100 | Exceptional 2.1% |
| Albanians | 94.9 /100 | #101 | Exceptional 2.1% |
| Sri Lankans | 94.8 /100 | #102 | Exceptional 2.1% |
| Immigrants | Austria | 94.4 /100 | #103 | Exceptional 2.1% |
| Immigrants | Italy | 94.4 /100 | #104 | Exceptional 2.1% |
Demographics Similar to Immigrants from Mexico by Vision Disability
In terms of vision disability, the demographic groups most similar to Immigrants from Mexico are Delaware (2.5%, a difference of 0.11%), Ottawa (2.5%, a difference of 0.32%), Yaqui (2.5%, a difference of 0.66%), Crow (2.5%, a difference of 0.68%), and Immigrants from Dominica (2.5%, a difference of 0.68%).
| Demographics | Rating | Rank | Vision Disability |
| Immigrants | Nonimmigrants | 0.0 /100 | #289 | Tragic 2.5% |
| Immigrants | Cuba | 0.0 /100 | #290 | Tragic 2.5% |
| Immigrants | Honduras | 0.0 /100 | #291 | Tragic 2.5% |
| Crow | 0.0 /100 | #292 | Tragic 2.5% |
| Yaqui | 0.0 /100 | #293 | Tragic 2.5% |
| Ottawa | 0.0 /100 | #294 | Tragic 2.5% |
| Delaware | 0.0 /100 | #295 | Tragic 2.5% |
| Immigrants | Mexico | 0.0 /100 | #296 | Tragic 2.5% |
| Immigrants | Dominica | 0.0 /100 | #297 | Tragic 2.5% |
| Mexicans | 0.0 /100 | #298 | Tragic 2.5% |
| Cree | 0.0 /100 | #299 | Tragic 2.5% |
| Africans | 0.0 /100 | #300 | Tragic 2.5% |
| Menominee | 0.0 /100 | #301 | Tragic 2.5% |
| Spanish American Indians | 0.0 /100 | #302 | Tragic 2.6% |
| Immigrants | Cabo Verde | 0.0 /100 | #303 | Tragic 2.6% |