Liberian vs Immigrants from Mexico Vision Disability
COMPARE
Liberian
Immigrants from Mexico
Vision Disability
Vision Disability Comparison
Liberians
Immigrants from Mexico
2.3%
VISION DISABILITY
0.5/ 100
METRIC RATING
249th/ 347
METRIC RANK
2.5%
VISION DISABILITY
0.0/ 100
METRIC RATING
296th/ 347
METRIC RANK
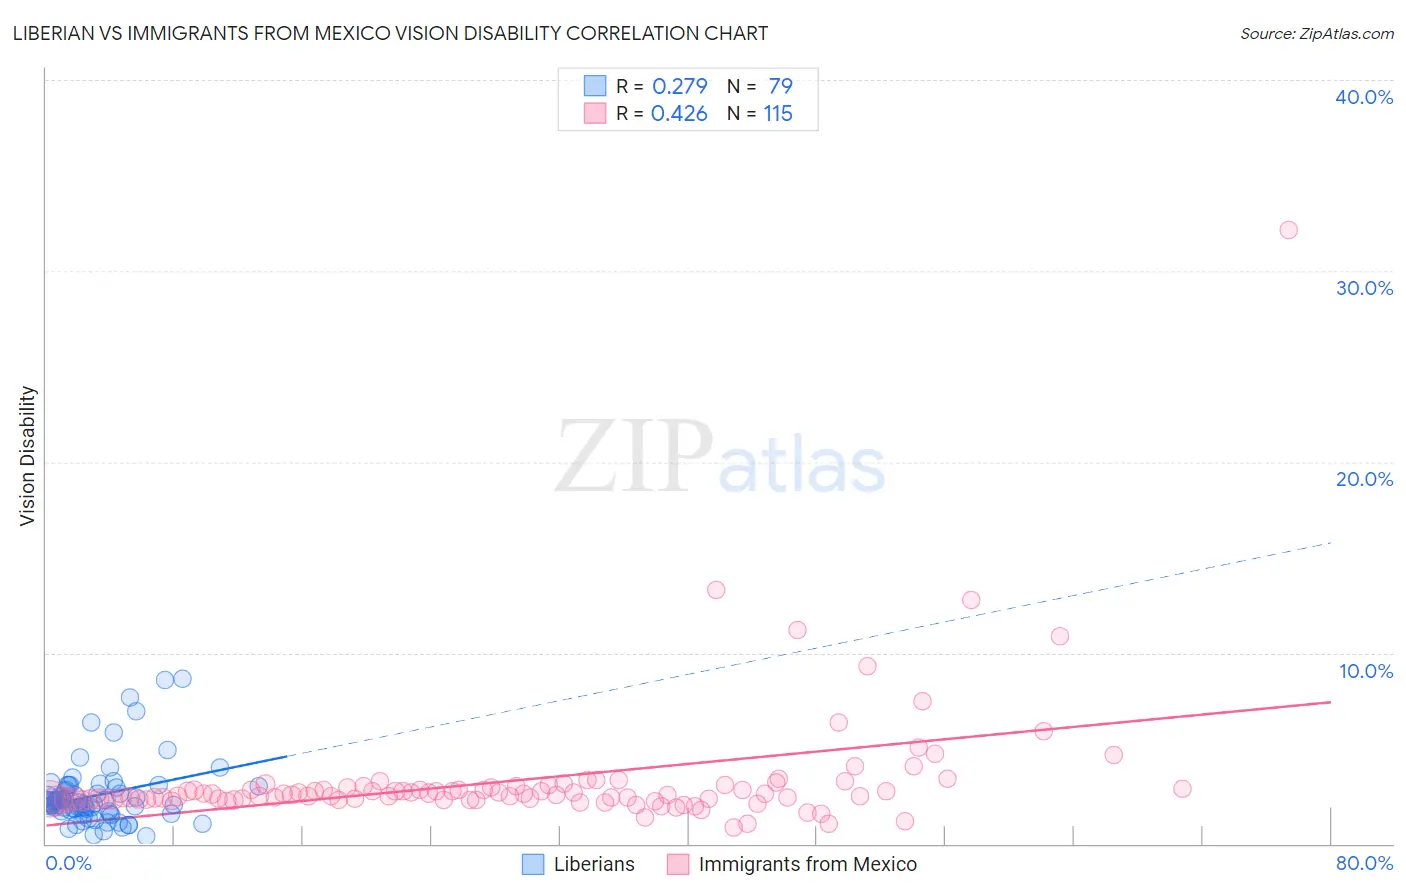
Liberian vs Immigrants from Mexico Vision Disability Correlation Chart
The statistical analysis conducted on geographies consisting of 118,074,683 people shows a weak positive correlation between the proportion of Liberians and percentage of population with vision disability in the United States with a correlation coefficient (R) of 0.279 and weighted average of 2.3%. Similarly, the statistical analysis conducted on geographies consisting of 512,775,331 people shows a moderate positive correlation between the proportion of Immigrants from Mexico and percentage of population with vision disability in the United States with a correlation coefficient (R) of 0.426 and weighted average of 2.5%, a difference of 7.0%.
Vision Disability Correlation Summary
| Measurement | Liberian | Immigrants from Mexico |
| Minimum | 0.37% | 0.88% |
| Maximum | 8.7% | 32.1% |
| Range | 8.3% | 31.3% |
| Mean | 2.5% | 3.3% |
| Median | 2.2% | 2.6% |
| Interquartile 25% (IQ1) | 1.7% | 2.3% |
| Interquartile 75% (IQ3) | 3.0% | 3.0% |
| Interquartile Range (IQR) | 1.3% | 0.66% |
| Standard Deviation (Sample) | 1.7% | 3.4% |
| Standard Deviation (Population) | 1.6% | 3.4% |
Similar Demographics by Vision Disability
Demographics Similar to Liberians by Vision Disability
In terms of vision disability, the demographic groups most similar to Liberians are Subsaharan African (2.3%, a difference of 0.010%), Guatemalan (2.3%, a difference of 0.030%), French (2.3%, a difference of 0.070%), Bangladeshi (2.3%, a difference of 0.080%), and Immigrants from Laos (2.4%, a difference of 0.19%).
| Demographics | Rating | Rank | Vision Disability |
| Immigrants | Panama | 0.8 /100 | #242 | Tragic 2.3% |
| Immigrants | Nicaragua | 0.6 /100 | #243 | Tragic 2.3% |
| Immigrants | West Indies | 0.6 /100 | #244 | Tragic 2.3% |
| Alsatians | 0.6 /100 | #245 | Tragic 2.3% |
| French | 0.5 /100 | #246 | Tragic 2.3% |
| Guatemalans | 0.5 /100 | #247 | Tragic 2.3% |
| Sub-Saharan Africans | 0.5 /100 | #248 | Tragic 2.3% |
| Liberians | 0.5 /100 | #249 | Tragic 2.3% |
| Bangladeshis | 0.5 /100 | #250 | Tragic 2.3% |
| Immigrants | Laos | 0.4 /100 | #251 | Tragic 2.4% |
| Immigrants | Micronesia | 0.3 /100 | #252 | Tragic 2.4% |
| Japanese | 0.3 /100 | #253 | Tragic 2.4% |
| Haitians | 0.3 /100 | #254 | Tragic 2.4% |
| Immigrants | Guatemala | 0.3 /100 | #255 | Tragic 2.4% |
| Immigrants | Haiti | 0.2 /100 | #256 | Tragic 2.4% |
Demographics Similar to Immigrants from Mexico by Vision Disability
In terms of vision disability, the demographic groups most similar to Immigrants from Mexico are Delaware (2.5%, a difference of 0.11%), Ottawa (2.5%, a difference of 0.32%), Yaqui (2.5%, a difference of 0.66%), Crow (2.5%, a difference of 0.68%), and Immigrants from Dominica (2.5%, a difference of 0.68%).
| Demographics | Rating | Rank | Vision Disability |
| Immigrants | Nonimmigrants | 0.0 /100 | #289 | Tragic 2.5% |
| Immigrants | Cuba | 0.0 /100 | #290 | Tragic 2.5% |
| Immigrants | Honduras | 0.0 /100 | #291 | Tragic 2.5% |
| Crow | 0.0 /100 | #292 | Tragic 2.5% |
| Yaqui | 0.0 /100 | #293 | Tragic 2.5% |
| Ottawa | 0.0 /100 | #294 | Tragic 2.5% |
| Delaware | 0.0 /100 | #295 | Tragic 2.5% |
| Immigrants | Mexico | 0.0 /100 | #296 | Tragic 2.5% |
| Immigrants | Dominica | 0.0 /100 | #297 | Tragic 2.5% |
| Mexicans | 0.0 /100 | #298 | Tragic 2.5% |
| Cree | 0.0 /100 | #299 | Tragic 2.5% |
| Africans | 0.0 /100 | #300 | Tragic 2.5% |
| Menominee | 0.0 /100 | #301 | Tragic 2.5% |
| Spanish American Indians | 0.0 /100 | #302 | Tragic 2.6% |
| Immigrants | Cabo Verde | 0.0 /100 | #303 | Tragic 2.6% |