Swedish vs Immigrants from Haiti Hearing Disability
COMPARE
Swedish
Immigrants from Haiti
Hearing Disability
Hearing Disability Comparison
Swedes
Immigrants from Haiti
3.6%
HEARING DISABILITY
0.0/ 100
METRIC RATING
282nd/ 347
METRIC RANK
2.6%
HEARING DISABILITY
99.7/ 100
METRIC RATING
28th/ 347
METRIC RANK
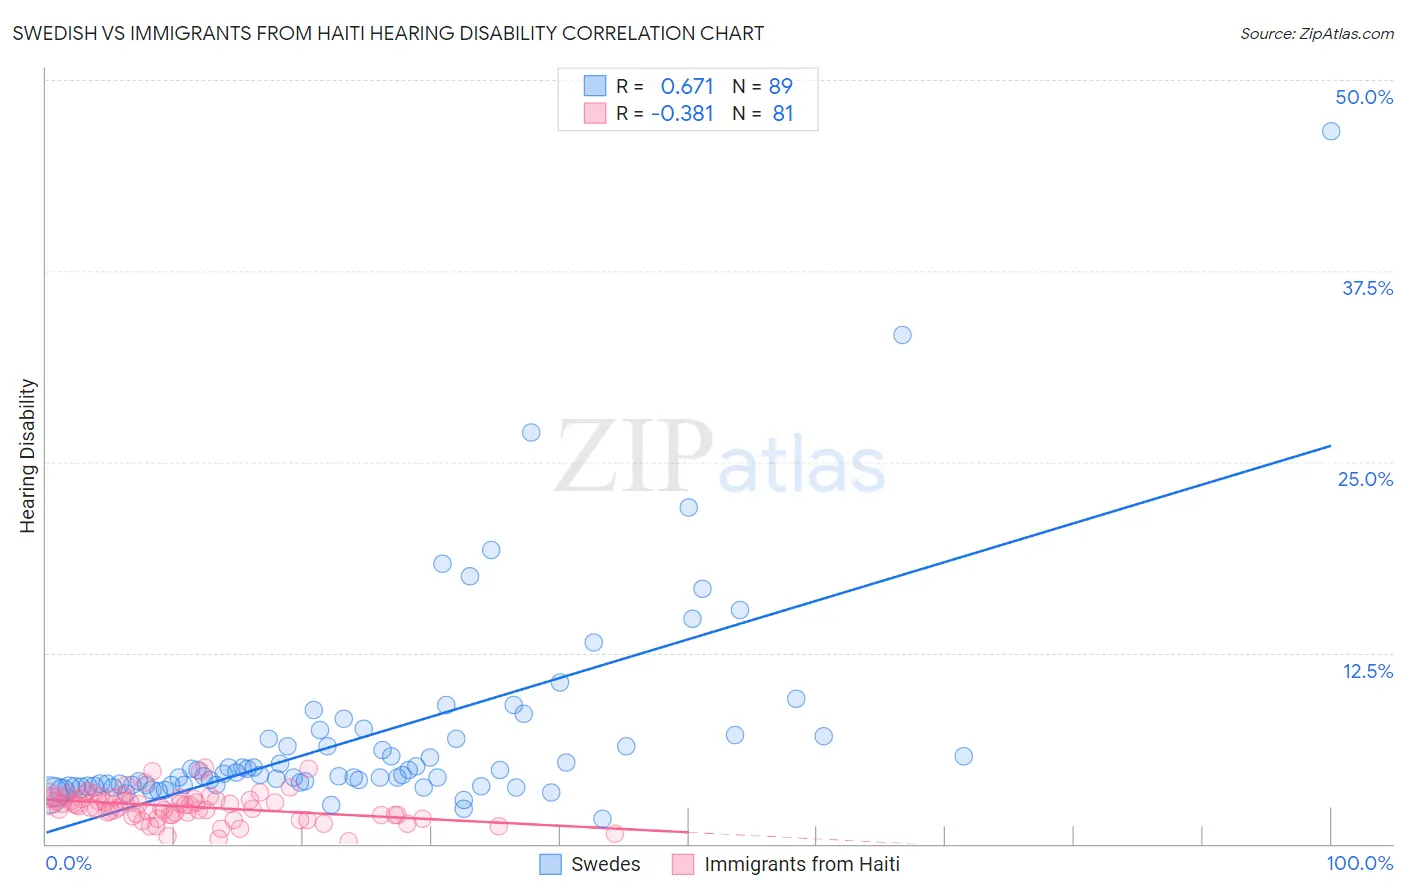
Swedish vs Immigrants from Haiti Hearing Disability Correlation Chart
The statistical analysis conducted on geographies consisting of 538,765,459 people shows a significant positive correlation between the proportion of Swedes and percentage of population with hearing disability in the United States with a correlation coefficient (R) of 0.671 and weighted average of 3.6%. Similarly, the statistical analysis conducted on geographies consisting of 225,193,212 people shows a mild negative correlation between the proportion of Immigrants from Haiti and percentage of population with hearing disability in the United States with a correlation coefficient (R) of -0.381 and weighted average of 2.6%, a difference of 39.4%.
Hearing Disability Correlation Summary
| Measurement | Swedish | Immigrants from Haiti |
| Minimum | 1.7% | 0.20% |
| Maximum | 46.7% | 5.0% |
| Range | 45.0% | 4.8% |
| Mean | 7.0% | 2.4% |
| Median | 4.5% | 2.5% |
| Interquartile 25% (IQ1) | 3.8% | 1.9% |
| Interquartile 75% (IQ3) | 6.9% | 3.0% |
| Interquartile Range (IQR) | 3.1% | 1.1% |
| Standard Deviation (Sample) | 6.8% | 0.97% |
| Standard Deviation (Population) | 6.8% | 0.96% |
Similar Demographics by Hearing Disability
Demographics Similar to Swedes by Hearing Disability
In terms of hearing disability, the demographic groups most similar to Swedes are Scandinavian (3.6%, a difference of 0.090%), French American Indian (3.6%, a difference of 0.15%), Slovak (3.6%, a difference of 0.21%), Blackfeet (3.6%, a difference of 0.25%), and Basque (3.6%, a difference of 0.48%).
| Demographics | Rating | Rank | Hearing Disability |
| Czechoslovakians | 0.0 /100 | #275 | Tragic 3.6% |
| Danes | 0.0 /100 | #276 | Tragic 3.6% |
| Immigrants | Nonimmigrants | 0.0 /100 | #277 | Tragic 3.6% |
| Basques | 0.0 /100 | #278 | Tragic 3.6% |
| Slovaks | 0.0 /100 | #279 | Tragic 3.6% |
| French American Indians | 0.0 /100 | #280 | Tragic 3.6% |
| Scandinavians | 0.0 /100 | #281 | Tragic 3.6% |
| Swedes | 0.0 /100 | #282 | Tragic 3.6% |
| Blackfeet | 0.0 /100 | #283 | Tragic 3.6% |
| Immigrants | Micronesia | 0.0 /100 | #284 | Tragic 3.6% |
| Sioux | 0.0 /100 | #285 | Tragic 3.6% |
| Delaware | 0.0 /100 | #286 | Tragic 3.6% |
| Spanish | 0.0 /100 | #287 | Tragic 3.7% |
| Irish | 0.0 /100 | #288 | Tragic 3.7% |
| Chinese | 0.0 /100 | #289 | Tragic 3.7% |
Demographics Similar to Immigrants from Haiti by Hearing Disability
In terms of hearing disability, the demographic groups most similar to Immigrants from Haiti are Bolivian (2.6%, a difference of 0.020%), Immigrants from Caribbean (2.6%, a difference of 0.10%), Immigrants from Cameroon (2.6%, a difference of 0.11%), Immigrants from Venezuela (2.6%, a difference of 0.26%), and Immigrants from South Central Asia (2.6%, a difference of 0.37%).
| Demographics | Rating | Rank | Hearing Disability |
| Ghanaians | 99.8 /100 | #21 | Exceptional 2.5% |
| Immigrants | Sierra Leone | 99.8 /100 | #22 | Exceptional 2.6% |
| Immigrants | Nigeria | 99.8 /100 | #23 | Exceptional 2.6% |
| Immigrants | Ghana | 99.8 /100 | #24 | Exceptional 2.6% |
| Immigrants | El Salvador | 99.7 /100 | #25 | Exceptional 2.6% |
| Immigrants | Senegal | 99.7 /100 | #26 | Exceptional 2.6% |
| Immigrants | South Central Asia | 99.7 /100 | #27 | Exceptional 2.6% |
| Immigrants | Haiti | 99.7 /100 | #28 | Exceptional 2.6% |
| Bolivians | 99.7 /100 | #29 | Exceptional 2.6% |
| Immigrants | Caribbean | 99.7 /100 | #30 | Exceptional 2.6% |
| Immigrants | Cameroon | 99.7 /100 | #31 | Exceptional 2.6% |
| Immigrants | Venezuela | 99.7 /100 | #32 | Exceptional 2.6% |
| Filipinos | 99.6 /100 | #33 | Exceptional 2.6% |
| Immigrants | Pakistan | 99.6 /100 | #34 | Exceptional 2.6% |
| Salvadorans | 99.6 /100 | #35 | Exceptional 2.6% |