Polish vs Immigrants from Haiti Hearing Disability
COMPARE
Polish
Immigrants from Haiti
Hearing Disability
Hearing Disability Comparison
Poles
Immigrants from Haiti
3.4%
HEARING DISABILITY
0.2/ 100
METRIC RATING
255th/ 347
METRIC RANK
2.6%
HEARING DISABILITY
99.7/ 100
METRIC RATING
28th/ 347
METRIC RANK
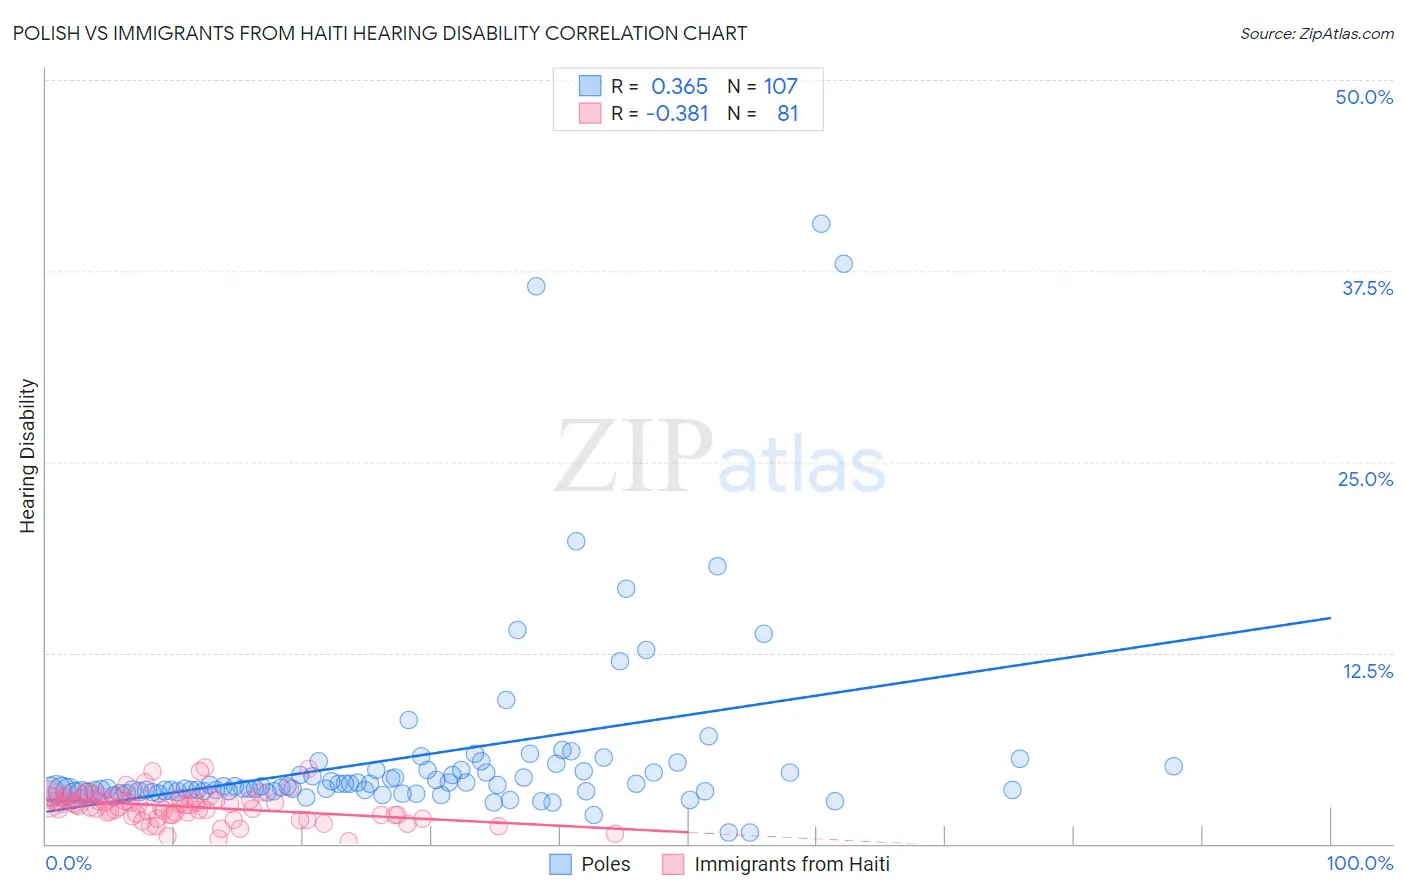
Polish vs Immigrants from Haiti Hearing Disability Correlation Chart
The statistical analysis conducted on geographies consisting of 559,927,295 people shows a mild positive correlation between the proportion of Poles and percentage of population with hearing disability in the United States with a correlation coefficient (R) of 0.365 and weighted average of 3.4%. Similarly, the statistical analysis conducted on geographies consisting of 225,193,212 people shows a mild negative correlation between the proportion of Immigrants from Haiti and percentage of population with hearing disability in the United States with a correlation coefficient (R) of -0.381 and weighted average of 2.6%, a difference of 32.3%.
Hearing Disability Correlation Summary
| Measurement | Polish | Immigrants from Haiti |
| Minimum | 0.74% | 0.20% |
| Maximum | 40.6% | 5.0% |
| Range | 39.8% | 4.8% |
| Mean | 5.7% | 2.4% |
| Median | 3.7% | 2.5% |
| Interquartile 25% (IQ1) | 3.4% | 1.9% |
| Interquartile 75% (IQ3) | 4.8% | 3.0% |
| Interquartile Range (IQR) | 1.4% | 1.1% |
| Standard Deviation (Sample) | 6.4% | 0.97% |
| Standard Deviation (Population) | 6.4% | 0.96% |
Similar Demographics by Hearing Disability
Demographics Similar to Poles by Hearing Disability
In terms of hearing disability, the demographic groups most similar to Poles are Hmong (3.4%, a difference of 0.040%), Slavic (3.4%, a difference of 0.23%), Yaqui (3.4%, a difference of 0.49%), Northern European (3.4%, a difference of 0.56%), and Carpatho Rusyn (3.4%, a difference of 0.65%).
| Demographics | Rating | Rank | Hearing Disability |
| Austrians | 0.6 /100 | #248 | Tragic 3.4% |
| Italians | 0.4 /100 | #249 | Tragic 3.4% |
| Yuman | 0.4 /100 | #250 | Tragic 3.4% |
| Hungarians | 0.4 /100 | #251 | Tragic 3.4% |
| Croatians | 0.4 /100 | #252 | Tragic 3.4% |
| Carpatho Rusyns | 0.3 /100 | #253 | Tragic 3.4% |
| Slavs | 0.2 /100 | #254 | Tragic 3.4% |
| Poles | 0.2 /100 | #255 | Tragic 3.4% |
| Hmong | 0.2 /100 | #256 | Tragic 3.4% |
| Yaqui | 0.2 /100 | #257 | Tragic 3.4% |
| Northern Europeans | 0.2 /100 | #258 | Tragic 3.4% |
| Slovenes | 0.1 /100 | #259 | Tragic 3.5% |
| Portuguese | 0.1 /100 | #260 | Tragic 3.5% |
| Hawaiians | 0.1 /100 | #261 | Tragic 3.5% |
| Immigrants | North America | 0.1 /100 | #262 | Tragic 3.5% |
Demographics Similar to Immigrants from Haiti by Hearing Disability
In terms of hearing disability, the demographic groups most similar to Immigrants from Haiti are Bolivian (2.6%, a difference of 0.020%), Immigrants from Caribbean (2.6%, a difference of 0.10%), Immigrants from Cameroon (2.6%, a difference of 0.11%), Immigrants from Venezuela (2.6%, a difference of 0.26%), and Immigrants from South Central Asia (2.6%, a difference of 0.37%).
| Demographics | Rating | Rank | Hearing Disability |
| Ghanaians | 99.8 /100 | #21 | Exceptional 2.5% |
| Immigrants | Sierra Leone | 99.8 /100 | #22 | Exceptional 2.6% |
| Immigrants | Nigeria | 99.8 /100 | #23 | Exceptional 2.6% |
| Immigrants | Ghana | 99.8 /100 | #24 | Exceptional 2.6% |
| Immigrants | El Salvador | 99.7 /100 | #25 | Exceptional 2.6% |
| Immigrants | Senegal | 99.7 /100 | #26 | Exceptional 2.6% |
| Immigrants | South Central Asia | 99.7 /100 | #27 | Exceptional 2.6% |
| Immigrants | Haiti | 99.7 /100 | #28 | Exceptional 2.6% |
| Bolivians | 99.7 /100 | #29 | Exceptional 2.6% |
| Immigrants | Caribbean | 99.7 /100 | #30 | Exceptional 2.6% |
| Immigrants | Cameroon | 99.7 /100 | #31 | Exceptional 2.6% |
| Immigrants | Venezuela | 99.7 /100 | #32 | Exceptional 2.6% |
| Filipinos | 99.6 /100 | #33 | Exceptional 2.6% |
| Immigrants | Pakistan | 99.6 /100 | #34 | Exceptional 2.6% |
| Salvadorans | 99.6 /100 | #35 | Exceptional 2.6% |