Immigrants from England vs Immigrants from Haiti Hearing Disability
COMPARE
Immigrants from England
Immigrants from Haiti
Hearing Disability
Hearing Disability Comparison
Immigrants from England
Immigrants from Haiti
3.3%
HEARING DISABILITY
0.7/ 100
METRIC RATING
246th/ 347
METRIC RANK
2.6%
HEARING DISABILITY
99.7/ 100
METRIC RATING
28th/ 347
METRIC RANK
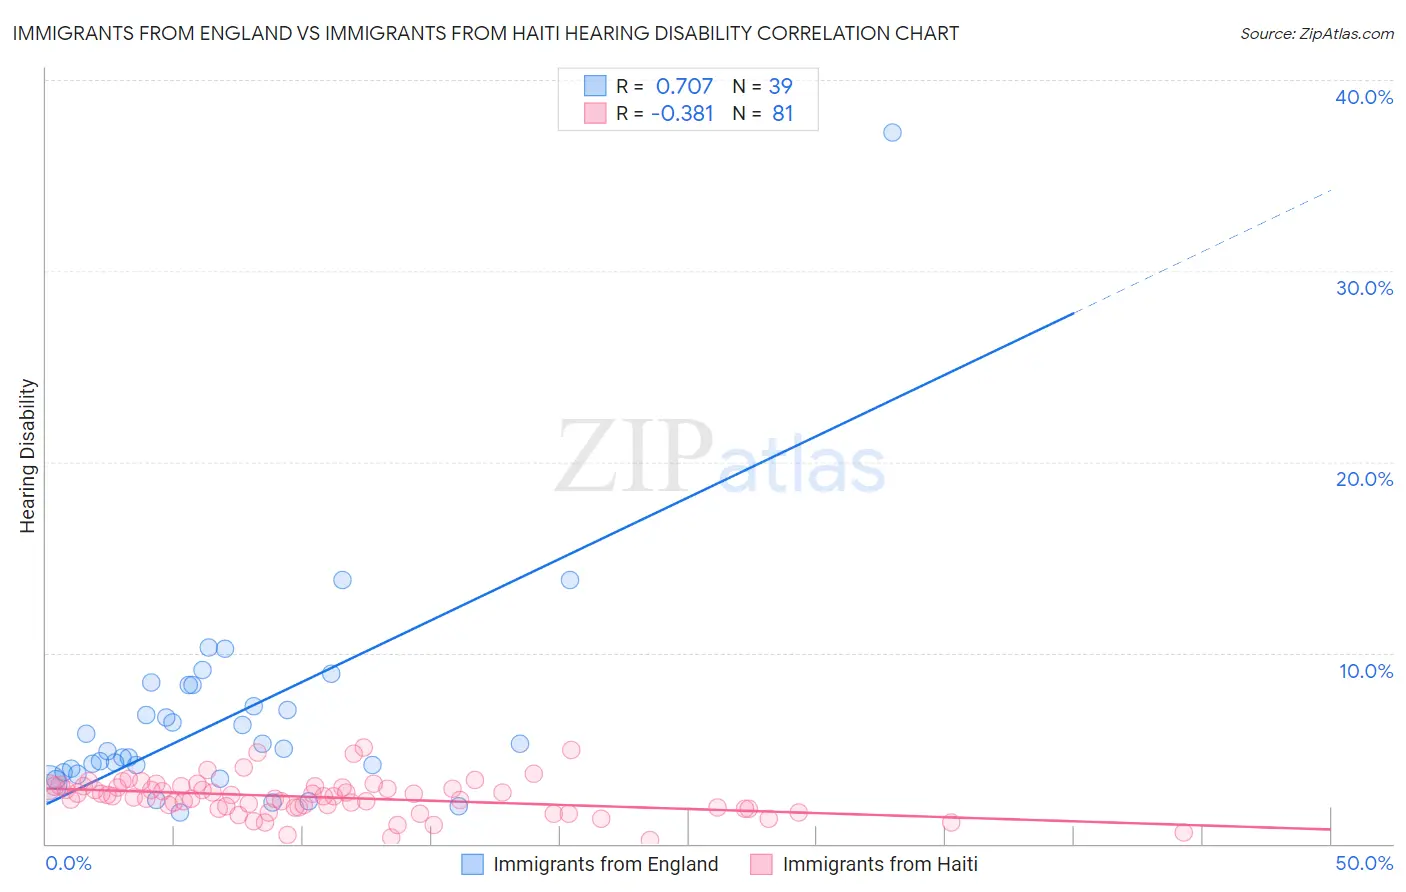
Immigrants from England vs Immigrants from Haiti Hearing Disability Correlation Chart
The statistical analysis conducted on geographies consisting of 391,804,752 people shows a strong positive correlation between the proportion of Immigrants from England and percentage of population with hearing disability in the United States with a correlation coefficient (R) of 0.707 and weighted average of 3.3%. Similarly, the statistical analysis conducted on geographies consisting of 225,193,212 people shows a mild negative correlation between the proportion of Immigrants from Haiti and percentage of population with hearing disability in the United States with a correlation coefficient (R) of -0.381 and weighted average of 2.6%, a difference of 29.1%.
Hearing Disability Correlation Summary
| Measurement | Immigrants from England | Immigrants from Haiti |
| Minimum | 1.6% | 0.20% |
| Maximum | 37.3% | 5.0% |
| Range | 35.7% | 4.8% |
| Mean | 6.6% | 2.4% |
| Median | 5.0% | 2.5% |
| Interquartile 25% (IQ1) | 3.8% | 1.9% |
| Interquartile 75% (IQ3) | 8.3% | 3.0% |
| Interquartile Range (IQR) | 4.5% | 1.1% |
| Standard Deviation (Sample) | 5.9% | 0.97% |
| Standard Deviation (Population) | 5.8% | 0.96% |
Similar Demographics by Hearing Disability
Demographics Similar to Immigrants from England by Hearing Disability
In terms of hearing disability, the demographic groups most similar to Immigrants from England are Lithuanian (3.4%, a difference of 0.20%), Immigrants from Scotland (3.3%, a difference of 0.28%), Austrian (3.4%, a difference of 0.42%), Assyrian/Chaldean/Syriac (3.3%, a difference of 0.62%), and Immigrants from Western Europe (3.3%, a difference of 0.69%).
| Demographics | Rating | Rank | Hearing Disability |
| Nepalese | 1.2 /100 | #239 | Tragic 3.3% |
| Immigrants | Netherlands | 1.1 /100 | #240 | Tragic 3.3% |
| Samoans | 1.1 /100 | #241 | Tragic 3.3% |
| Yugoslavians | 1.0 /100 | #242 | Tragic 3.3% |
| Immigrants | Western Europe | 1.0 /100 | #243 | Tragic 3.3% |
| Assyrians/Chaldeans/Syriacs | 0.9 /100 | #244 | Tragic 3.3% |
| Immigrants | Scotland | 0.8 /100 | #245 | Tragic 3.3% |
| Immigrants | England | 0.7 /100 | #246 | Tragic 3.3% |
| Lithuanians | 0.6 /100 | #247 | Tragic 3.4% |
| Austrians | 0.6 /100 | #248 | Tragic 3.4% |
| Italians | 0.4 /100 | #249 | Tragic 3.4% |
| Yuman | 0.4 /100 | #250 | Tragic 3.4% |
| Hungarians | 0.4 /100 | #251 | Tragic 3.4% |
| Croatians | 0.4 /100 | #252 | Tragic 3.4% |
| Carpatho Rusyns | 0.3 /100 | #253 | Tragic 3.4% |
Demographics Similar to Immigrants from Haiti by Hearing Disability
In terms of hearing disability, the demographic groups most similar to Immigrants from Haiti are Bolivian (2.6%, a difference of 0.020%), Immigrants from Caribbean (2.6%, a difference of 0.10%), Immigrants from Cameroon (2.6%, a difference of 0.11%), Immigrants from Venezuela (2.6%, a difference of 0.26%), and Immigrants from South Central Asia (2.6%, a difference of 0.37%).
| Demographics | Rating | Rank | Hearing Disability |
| Ghanaians | 99.8 /100 | #21 | Exceptional 2.5% |
| Immigrants | Sierra Leone | 99.8 /100 | #22 | Exceptional 2.6% |
| Immigrants | Nigeria | 99.8 /100 | #23 | Exceptional 2.6% |
| Immigrants | Ghana | 99.8 /100 | #24 | Exceptional 2.6% |
| Immigrants | El Salvador | 99.7 /100 | #25 | Exceptional 2.6% |
| Immigrants | Senegal | 99.7 /100 | #26 | Exceptional 2.6% |
| Immigrants | South Central Asia | 99.7 /100 | #27 | Exceptional 2.6% |
| Immigrants | Haiti | 99.7 /100 | #28 | Exceptional 2.6% |
| Bolivians | 99.7 /100 | #29 | Exceptional 2.6% |
| Immigrants | Caribbean | 99.7 /100 | #30 | Exceptional 2.6% |
| Immigrants | Cameroon | 99.7 /100 | #31 | Exceptional 2.6% |
| Immigrants | Venezuela | 99.7 /100 | #32 | Exceptional 2.6% |
| Filipinos | 99.6 /100 | #33 | Exceptional 2.6% |
| Immigrants | Pakistan | 99.6 /100 | #34 | Exceptional 2.6% |
| Salvadorans | 99.6 /100 | #35 | Exceptional 2.6% |