Swedish vs Indonesian Hearing Disability
COMPARE
Swedish
Indonesian
Hearing Disability
Hearing Disability Comparison
Swedes
Indonesians
3.6%
HEARING DISABILITY
0.0/ 100
METRIC RATING
282nd/ 347
METRIC RANK
3.0%
HEARING DISABILITY
50.0/ 100
METRIC RATING
174th/ 347
METRIC RANK
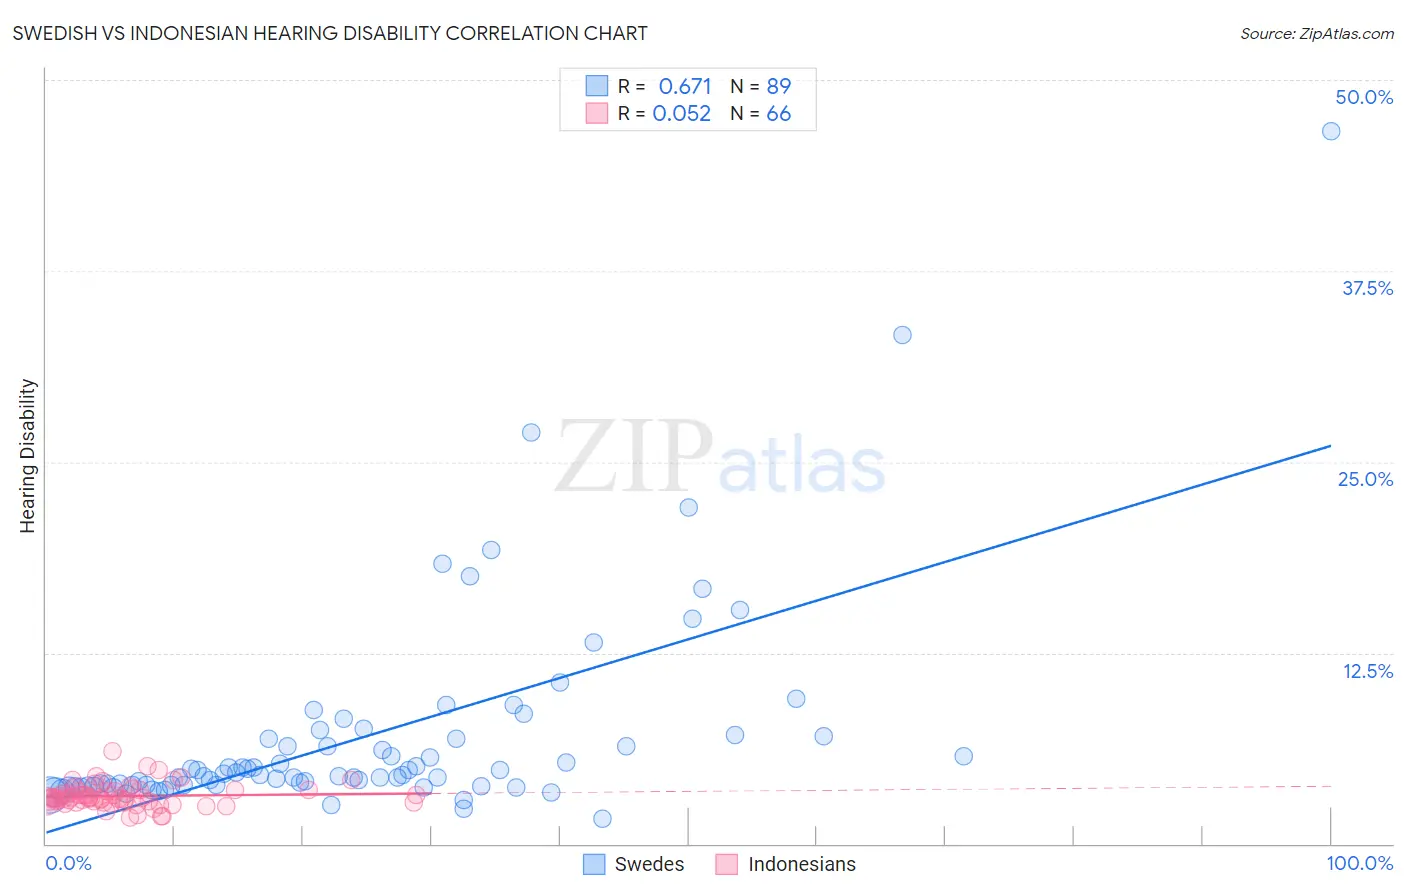
Swedish vs Indonesian Hearing Disability Correlation Chart
The statistical analysis conducted on geographies consisting of 538,765,459 people shows a significant positive correlation between the proportion of Swedes and percentage of population with hearing disability in the United States with a correlation coefficient (R) of 0.671 and weighted average of 3.6%. Similarly, the statistical analysis conducted on geographies consisting of 162,712,872 people shows a slight positive correlation between the proportion of Indonesians and percentage of population with hearing disability in the United States with a correlation coefficient (R) of 0.052 and weighted average of 3.0%, a difference of 20.6%.
Hearing Disability Correlation Summary
| Measurement | Swedish | Indonesian |
| Minimum | 1.7% | 1.7% |
| Maximum | 46.7% | 6.0% |
| Range | 45.0% | 4.3% |
| Mean | 7.0% | 3.1% |
| Median | 4.5% | 3.0% |
| Interquartile 25% (IQ1) | 3.8% | 2.7% |
| Interquartile 75% (IQ3) | 6.9% | 3.5% |
| Interquartile Range (IQR) | 3.1% | 0.72% |
| Standard Deviation (Sample) | 6.8% | 0.76% |
| Standard Deviation (Population) | 6.8% | 0.76% |
Similar Demographics by Hearing Disability
Demographics Similar to Swedes by Hearing Disability
In terms of hearing disability, the demographic groups most similar to Swedes are Scandinavian (3.6%, a difference of 0.090%), French American Indian (3.6%, a difference of 0.15%), Slovak (3.6%, a difference of 0.21%), Blackfeet (3.6%, a difference of 0.25%), and Basque (3.6%, a difference of 0.48%).
| Demographics | Rating | Rank | Hearing Disability |
| Czechoslovakians | 0.0 /100 | #275 | Tragic 3.6% |
| Danes | 0.0 /100 | #276 | Tragic 3.6% |
| Immigrants | Nonimmigrants | 0.0 /100 | #277 | Tragic 3.6% |
| Basques | 0.0 /100 | #278 | Tragic 3.6% |
| Slovaks | 0.0 /100 | #279 | Tragic 3.6% |
| French American Indians | 0.0 /100 | #280 | Tragic 3.6% |
| Scandinavians | 0.0 /100 | #281 | Tragic 3.6% |
| Swedes | 0.0 /100 | #282 | Tragic 3.6% |
| Blackfeet | 0.0 /100 | #283 | Tragic 3.6% |
| Immigrants | Micronesia | 0.0 /100 | #284 | Tragic 3.6% |
| Sioux | 0.0 /100 | #285 | Tragic 3.6% |
| Delaware | 0.0 /100 | #286 | Tragic 3.6% |
| Spanish | 0.0 /100 | #287 | Tragic 3.7% |
| Irish | 0.0 /100 | #288 | Tragic 3.7% |
| Chinese | 0.0 /100 | #289 | Tragic 3.7% |
Demographics Similar to Indonesians by Hearing Disability
In terms of hearing disability, the demographic groups most similar to Indonesians are Immigrants from Serbia (3.0%, a difference of 0.10%), Immigrants from Romania (3.0%, a difference of 0.15%), Panamanian (3.0%, a difference of 0.28%), Immigrants from Philippines (3.0%, a difference of 0.34%), and Japanese (3.0%, a difference of 0.38%).
| Demographics | Rating | Rank | Hearing Disability |
| Immigrants | Eastern Europe | 58.1 /100 | #167 | Average 3.0% |
| Immigrants | Greece | 57.9 /100 | #168 | Average 3.0% |
| Arabs | 57.6 /100 | #169 | Average 3.0% |
| Immigrants | Cabo Verde | 56.9 /100 | #170 | Average 3.0% |
| Immigrants | Ukraine | 56.6 /100 | #171 | Average 3.0% |
| Armenians | 56.0 /100 | #172 | Average 3.0% |
| Immigrants | Serbia | 51.1 /100 | #173 | Average 3.0% |
| Indonesians | 50.0 /100 | #174 | Average 3.0% |
| Immigrants | Romania | 48.4 /100 | #175 | Average 3.0% |
| Panamanians | 47.0 /100 | #176 | Average 3.0% |
| Immigrants | Philippines | 46.4 /100 | #177 | Average 3.0% |
| Japanese | 46.0 /100 | #178 | Average 3.0% |
| Immigrants | Moldova | 43.1 /100 | #179 | Average 3.0% |
| Immigrants | Sweden | 42.4 /100 | #180 | Average 3.0% |
| Immigrants | Belgium | 41.5 /100 | #181 | Average 3.0% |