Swedish vs Chilean Hearing Disability
COMPARE
Swedish
Chilean
Hearing Disability
Hearing Disability Comparison
Swedes
Chileans
3.6%
HEARING DISABILITY
0.0/ 100
METRIC RATING
282nd/ 347
METRIC RANK
2.9%
HEARING DISABILITY
85.8/ 100
METRIC RATING
132nd/ 347
METRIC RANK
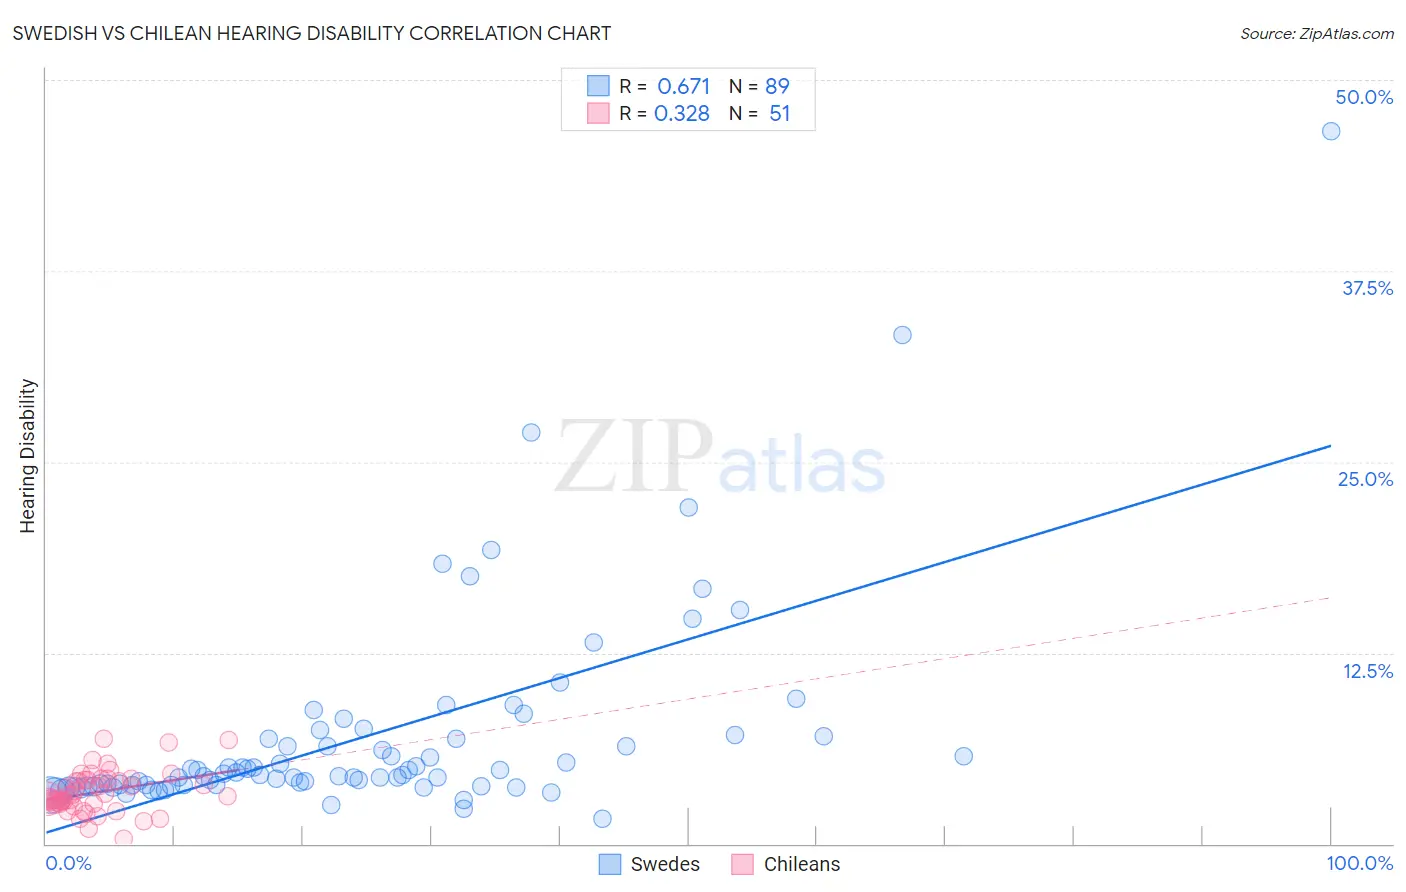
Swedish vs Chilean Hearing Disability Correlation Chart
The statistical analysis conducted on geographies consisting of 538,765,459 people shows a significant positive correlation between the proportion of Swedes and percentage of population with hearing disability in the United States with a correlation coefficient (R) of 0.671 and weighted average of 3.6%. Similarly, the statistical analysis conducted on geographies consisting of 256,625,228 people shows a mild positive correlation between the proportion of Chileans and percentage of population with hearing disability in the United States with a correlation coefficient (R) of 0.328 and weighted average of 2.9%, a difference of 25.9%.
Hearing Disability Correlation Summary
| Measurement | Swedish | Chilean |
| Minimum | 1.7% | 0.32% |
| Maximum | 46.7% | 6.9% |
| Range | 45.0% | 6.5% |
| Mean | 7.0% | 3.4% |
| Median | 4.5% | 3.1% |
| Interquartile 25% (IQ1) | 3.8% | 2.6% |
| Interquartile 75% (IQ3) | 6.9% | 4.2% |
| Interquartile Range (IQR) | 3.1% | 1.6% |
| Standard Deviation (Sample) | 6.8% | 1.4% |
| Standard Deviation (Population) | 6.8% | 1.4% |
Similar Demographics by Hearing Disability
Demographics Similar to Swedes by Hearing Disability
In terms of hearing disability, the demographic groups most similar to Swedes are Scandinavian (3.6%, a difference of 0.090%), French American Indian (3.6%, a difference of 0.15%), Slovak (3.6%, a difference of 0.21%), Blackfeet (3.6%, a difference of 0.25%), and Basque (3.6%, a difference of 0.48%).
| Demographics | Rating | Rank | Hearing Disability |
| Czechoslovakians | 0.0 /100 | #275 | Tragic 3.6% |
| Danes | 0.0 /100 | #276 | Tragic 3.6% |
| Immigrants | Nonimmigrants | 0.0 /100 | #277 | Tragic 3.6% |
| Basques | 0.0 /100 | #278 | Tragic 3.6% |
| Slovaks | 0.0 /100 | #279 | Tragic 3.6% |
| French American Indians | 0.0 /100 | #280 | Tragic 3.6% |
| Scandinavians | 0.0 /100 | #281 | Tragic 3.6% |
| Swedes | 0.0 /100 | #282 | Tragic 3.6% |
| Blackfeet | 0.0 /100 | #283 | Tragic 3.6% |
| Immigrants | Micronesia | 0.0 /100 | #284 | Tragic 3.6% |
| Sioux | 0.0 /100 | #285 | Tragic 3.6% |
| Delaware | 0.0 /100 | #286 | Tragic 3.6% |
| Spanish | 0.0 /100 | #287 | Tragic 3.7% |
| Irish | 0.0 /100 | #288 | Tragic 3.7% |
| Chinese | 0.0 /100 | #289 | Tragic 3.7% |
Demographics Similar to Chileans by Hearing Disability
In terms of hearing disability, the demographic groups most similar to Chileans are Immigrants from Syria (2.9%, a difference of 0.0%), Immigrants from Kenya (2.9%, a difference of 0.050%), Ugandan (2.9%, a difference of 0.070%), Immigrants from Vietnam (2.9%, a difference of 0.14%), and Immigrants from Uganda (2.9%, a difference of 0.16%).
| Demographics | Rating | Rank | Hearing Disability |
| Immigrants | Albania | 88.5 /100 | #125 | Excellent 2.9% |
| Immigrants | Sudan | 87.8 /100 | #126 | Excellent 2.9% |
| South American Indians | 86.9 /100 | #127 | Excellent 2.9% |
| Immigrants | Western Asia | 86.9 /100 | #128 | Excellent 2.9% |
| Immigrants | Uganda | 86.6 /100 | #129 | Excellent 2.9% |
| Immigrants | Vietnam | 86.5 /100 | #130 | Excellent 2.9% |
| Immigrants | Kenya | 86.1 /100 | #131 | Excellent 2.9% |
| Chileans | 85.8 /100 | #132 | Excellent 2.9% |
| Immigrants | Syria | 85.8 /100 | #133 | Excellent 2.9% |
| Ugandans | 85.5 /100 | #134 | Excellent 2.9% |
| Soviet Union | 84.8 /100 | #135 | Excellent 2.9% |
| Immigrants | Brazil | 84.6 /100 | #136 | Excellent 2.9% |
| Sri Lankans | 84.1 /100 | #137 | Excellent 2.9% |
| Immigrants | Costa Rica | 84.0 /100 | #138 | Excellent 2.9% |
| Bermudans | 83.8 /100 | #139 | Excellent 2.9% |