Menominee vs Puget Sound Salish Cognitive Disability
COMPARE
Menominee
Puget Sound Salish
Cognitive Disability
Cognitive Disability Comparison
Menominee
Puget Sound Salish
18.0%
COGNITIVE DISABILITY
0.4/ 100
METRIC RATING
264th/ 347
METRIC RANK
17.5%
COGNITIVE DISABILITY
10.9/ 100
METRIC RATING
205th/ 347
METRIC RANK
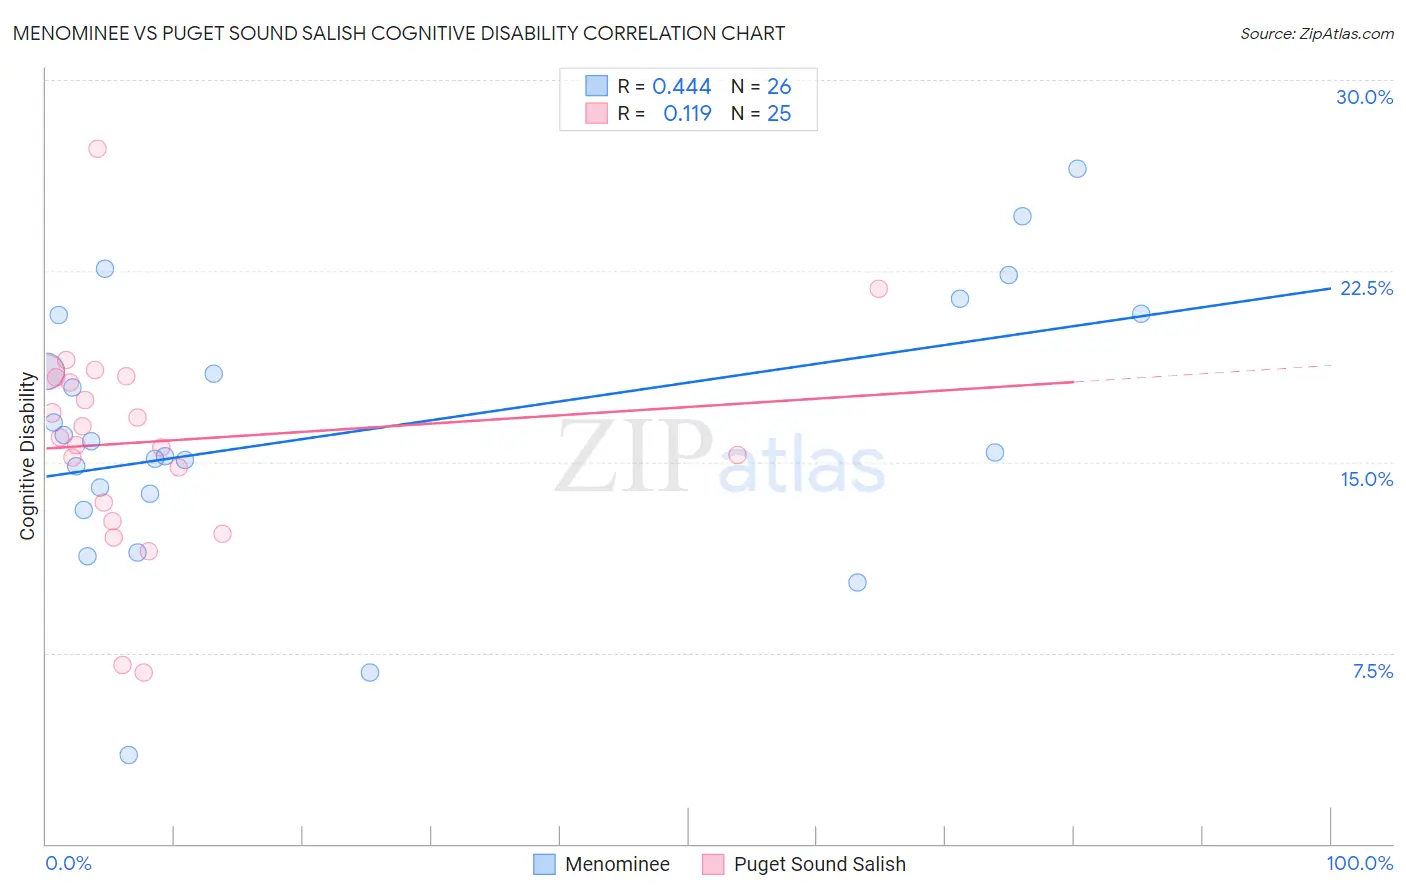
Menominee vs Puget Sound Salish Cognitive Disability Correlation Chart
The statistical analysis conducted on geographies consisting of 45,777,849 people shows a moderate positive correlation between the proportion of Menominee and percentage of population with cognitive disability in the United States with a correlation coefficient (R) of 0.444 and weighted average of 18.0%. Similarly, the statistical analysis conducted on geographies consisting of 46,155,775 people shows a poor positive correlation between the proportion of Puget Sound Salish and percentage of population with cognitive disability in the United States with a correlation coefficient (R) of 0.119 and weighted average of 17.5%, a difference of 2.4%.
Cognitive Disability Correlation Summary
| Measurement | Menominee | Puget Sound Salish |
| Minimum | 3.5% | 6.7% |
| Maximum | 26.5% | 27.3% |
| Range | 23.0% | 20.6% |
| Mean | 16.2% | 15.8% |
| Median | 15.6% | 16.0% |
| Interquartile 25% (IQ1) | 13.7% | 13.0% |
| Interquartile 75% (IQ3) | 20.8% | 18.3% |
| Interquartile Range (IQR) | 7.0% | 5.3% |
| Standard Deviation (Sample) | 5.3% | 4.3% |
| Standard Deviation (Population) | 5.2% | 4.2% |
Similar Demographics by Cognitive Disability
Demographics Similar to Menominee by Cognitive Disability
In terms of cognitive disability, the demographic groups most similar to Menominee are Spanish American (18.0%, a difference of 0.030%), Belizean (18.0%, a difference of 0.030%), Immigrants from Barbados (17.9%, a difference of 0.060%), Nepalese (18.0%, a difference of 0.090%), and Sierra Leonean (17.9%, a difference of 0.10%).
| Demographics | Rating | Rank | Cognitive Disability |
| Mexican American Indians | 0.6 /100 | #257 | Tragic 17.9% |
| Immigrants | Armenia | 0.6 /100 | #258 | Tragic 17.9% |
| Ethiopians | 0.5 /100 | #259 | Tragic 17.9% |
| Immigrants | Belize | 0.5 /100 | #260 | Tragic 17.9% |
| Guamanians/Chamorros | 0.5 /100 | #261 | Tragic 17.9% |
| Sierra Leoneans | 0.4 /100 | #262 | Tragic 17.9% |
| Immigrants | Barbados | 0.4 /100 | #263 | Tragic 17.9% |
| Menominee | 0.4 /100 | #264 | Tragic 18.0% |
| Spanish Americans | 0.4 /100 | #265 | Tragic 18.0% |
| Belizeans | 0.4 /100 | #266 | Tragic 18.0% |
| Nepalese | 0.3 /100 | #267 | Tragic 18.0% |
| Cherokee | 0.3 /100 | #268 | Tragic 18.0% |
| Hondurans | 0.3 /100 | #269 | Tragic 18.0% |
| Immigrants | Bahamas | 0.3 /100 | #270 | Tragic 18.0% |
| Potawatomi | 0.2 /100 | #271 | Tragic 18.0% |
Demographics Similar to Puget Sound Salish by Cognitive Disability
In terms of cognitive disability, the demographic groups most similar to Puget Sound Salish are Immigrants from Caribbean (17.5%, a difference of 0.010%), Immigrants from Zimbabwe (17.5%, a difference of 0.010%), Alaska Native (17.5%, a difference of 0.040%), Immigrants from Morocco (17.5%, a difference of 0.080%), and Immigrants from Latin America (17.6%, a difference of 0.090%).
| Demographics | Rating | Rank | Cognitive Disability |
| Immigrants | Panama | 14.8 /100 | #198 | Poor 17.5% |
| Immigrants | Singapore | 14.3 /100 | #199 | Poor 17.5% |
| Haitians | 14.1 /100 | #200 | Poor 17.5% |
| South American Indians | 13.0 /100 | #201 | Poor 17.5% |
| Immigrants | Morocco | 12.0 /100 | #202 | Poor 17.5% |
| Immigrants | Caribbean | 11.0 /100 | #203 | Poor 17.5% |
| Immigrants | Zimbabwe | 11.0 /100 | #204 | Poor 17.5% |
| Puget Sound Salish | 10.9 /100 | #205 | Poor 17.5% |
| Alaska Natives | 10.4 /100 | #206 | Poor 17.5% |
| Immigrants | Latin America | 9.7 /100 | #207 | Tragic 17.6% |
| Immigrants | Cameroon | 9.3 /100 | #208 | Tragic 17.6% |
| Immigrants | Trinidad and Tobago | 8.7 /100 | #209 | Tragic 17.6% |
| Immigrants | Jamaica | 8.5 /100 | #210 | Tragic 17.6% |
| Taiwanese | 7.7 /100 | #211 | Tragic 17.6% |
| Immigrants | Oceania | 7.3 /100 | #212 | Tragic 17.6% |