Czechoslovakian vs Puget Sound Salish Cognitive Disability
COMPARE
Czechoslovakian
Puget Sound Salish
Cognitive Disability
Cognitive Disability Comparison
Czechoslovakians
Puget Sound Salish
16.6%
COGNITIVE DISABILITY
99.6/ 100
METRIC RATING
62nd/ 347
METRIC RANK
17.5%
COGNITIVE DISABILITY
10.9/ 100
METRIC RATING
205th/ 347
METRIC RANK
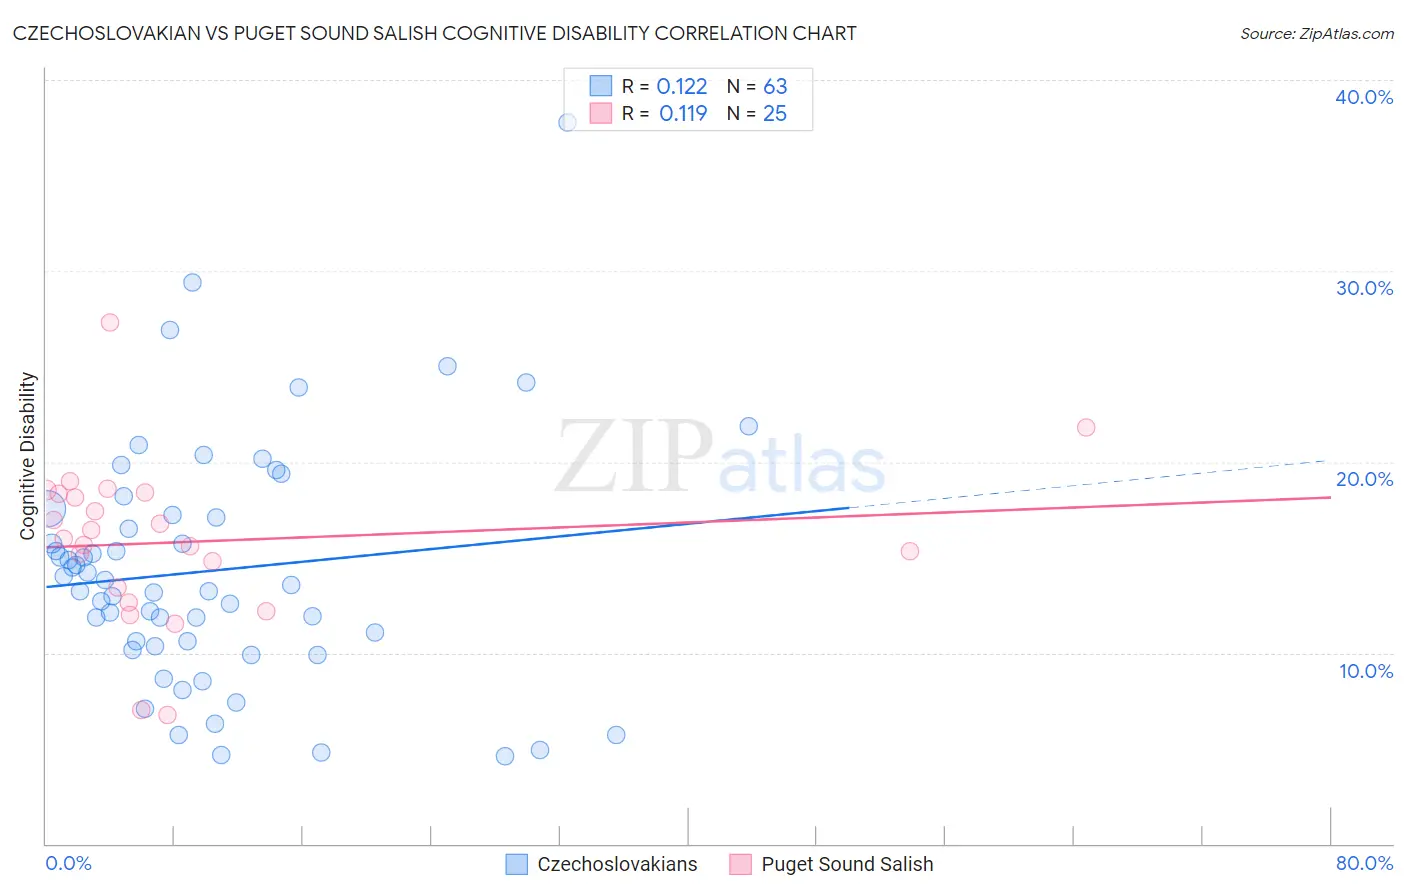
Czechoslovakian vs Puget Sound Salish Cognitive Disability Correlation Chart
The statistical analysis conducted on geographies consisting of 368,659,789 people shows a poor positive correlation between the proportion of Czechoslovakians and percentage of population with cognitive disability in the United States with a correlation coefficient (R) of 0.122 and weighted average of 16.6%. Similarly, the statistical analysis conducted on geographies consisting of 46,155,775 people shows a poor positive correlation between the proportion of Puget Sound Salish and percentage of population with cognitive disability in the United States with a correlation coefficient (R) of 0.119 and weighted average of 17.5%, a difference of 5.7%.
Cognitive Disability Correlation Summary
| Measurement | Czechoslovakian | Puget Sound Salish |
| Minimum | 4.6% | 6.7% |
| Maximum | 37.8% | 27.3% |
| Range | 33.2% | 20.6% |
| Mean | 14.3% | 15.8% |
| Median | 13.6% | 16.0% |
| Interquartile 25% (IQ1) | 10.4% | 13.0% |
| Interquartile 75% (IQ3) | 17.2% | 18.3% |
| Interquartile Range (IQR) | 6.9% | 5.3% |
| Standard Deviation (Sample) | 6.3% | 4.3% |
| Standard Deviation (Population) | 6.3% | 4.2% |
Similar Demographics by Cognitive Disability
Demographics Similar to Czechoslovakians by Cognitive Disability
In terms of cognitive disability, the demographic groups most similar to Czechoslovakians are Argentinean (16.6%, a difference of 0.020%), Immigrants from England (16.6%, a difference of 0.030%), Venezuelan (16.6%, a difference of 0.080%), Romanian (16.6%, a difference of 0.090%), and Pennsylvania German (16.6%, a difference of 0.10%).
| Demographics | Rating | Rank | Cognitive Disability |
| Immigrants | Venezuela | 99.7 /100 | #55 | Exceptional 16.5% |
| Austrians | 99.7 /100 | #56 | Exceptional 16.6% |
| Bhutanese | 99.7 /100 | #57 | Exceptional 16.6% |
| Pennsylvania Germans | 99.7 /100 | #58 | Exceptional 16.6% |
| Immigrants | Peru | 99.7 /100 | #59 | Exceptional 16.6% |
| Romanians | 99.7 /100 | #60 | Exceptional 16.6% |
| Immigrants | England | 99.6 /100 | #61 | Exceptional 16.6% |
| Czechoslovakians | 99.6 /100 | #62 | Exceptional 16.6% |
| Argentineans | 99.6 /100 | #63 | Exceptional 16.6% |
| Venezuelans | 99.6 /100 | #64 | Exceptional 16.6% |
| Colombians | 99.6 /100 | #65 | Exceptional 16.6% |
| Immigrants | Ukraine | 99.5 /100 | #66 | Exceptional 16.6% |
| Latvians | 99.5 /100 | #67 | Exceptional 16.6% |
| Ukrainians | 99.4 /100 | #68 | Exceptional 16.6% |
| Immigrants | Uzbekistan | 99.4 /100 | #69 | Exceptional 16.7% |
Demographics Similar to Puget Sound Salish by Cognitive Disability
In terms of cognitive disability, the demographic groups most similar to Puget Sound Salish are Immigrants from Caribbean (17.5%, a difference of 0.010%), Immigrants from Zimbabwe (17.5%, a difference of 0.010%), Alaska Native (17.5%, a difference of 0.040%), Immigrants from Morocco (17.5%, a difference of 0.080%), and Immigrants from Latin America (17.6%, a difference of 0.090%).
| Demographics | Rating | Rank | Cognitive Disability |
| Immigrants | Panama | 14.8 /100 | #198 | Poor 17.5% |
| Immigrants | Singapore | 14.3 /100 | #199 | Poor 17.5% |
| Haitians | 14.1 /100 | #200 | Poor 17.5% |
| South American Indians | 13.0 /100 | #201 | Poor 17.5% |
| Immigrants | Morocco | 12.0 /100 | #202 | Poor 17.5% |
| Immigrants | Caribbean | 11.0 /100 | #203 | Poor 17.5% |
| Immigrants | Zimbabwe | 11.0 /100 | #204 | Poor 17.5% |
| Puget Sound Salish | 10.9 /100 | #205 | Poor 17.5% |
| Alaska Natives | 10.4 /100 | #206 | Poor 17.5% |
| Immigrants | Latin America | 9.7 /100 | #207 | Tragic 17.6% |
| Immigrants | Cameroon | 9.3 /100 | #208 | Tragic 17.6% |
| Immigrants | Trinidad and Tobago | 8.7 /100 | #209 | Tragic 17.6% |
| Immigrants | Jamaica | 8.5 /100 | #210 | Tragic 17.6% |
| Taiwanese | 7.7 /100 | #211 | Tragic 17.6% |
| Immigrants | Oceania | 7.3 /100 | #212 | Tragic 17.6% |