Immigrants from Asia vs Immigrants from Pakistan Self-Care Disability
COMPARE
Immigrants from Asia
Immigrants from Pakistan
Self-Care Disability
Self-Care Disability Comparison
Immigrants from Asia
Immigrants from Pakistan
2.4%
SELF-CARE DISABILITY
96.9/ 100
METRIC RATING
95th/ 347
METRIC RANK
2.3%
SELF-CARE DISABILITY
99.8/ 100
METRIC RATING
43rd/ 347
METRIC RANK
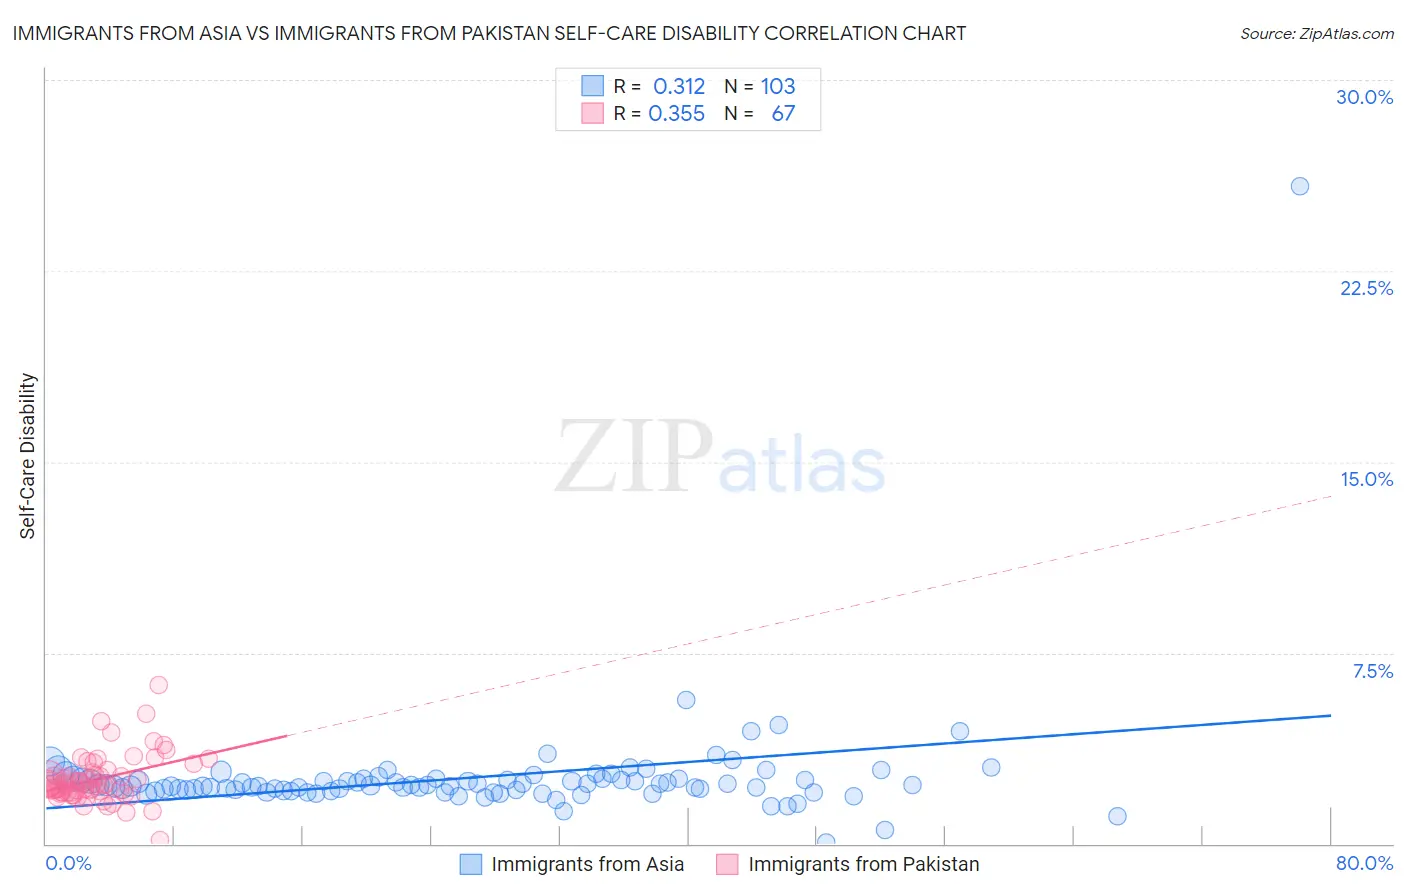
Immigrants from Asia vs Immigrants from Pakistan Self-Care Disability Correlation Chart
The statistical analysis conducted on geographies consisting of 547,490,821 people shows a mild positive correlation between the proportion of Immigrants from Asia and percentage of population with self-care disability in the United States with a correlation coefficient (R) of 0.312 and weighted average of 2.4%. Similarly, the statistical analysis conducted on geographies consisting of 283,675,484 people shows a mild positive correlation between the proportion of Immigrants from Pakistan and percentage of population with self-care disability in the United States with a correlation coefficient (R) of 0.355 and weighted average of 2.3%, a difference of 3.6%.
Self-Care Disability Correlation Summary
| Measurement | Immigrants from Asia | Immigrants from Pakistan |
| Minimum | 0.037% | 0.14% |
| Maximum | 25.8% | 6.2% |
| Range | 25.8% | 6.1% |
| Mean | 2.6% | 2.5% |
| Median | 2.3% | 2.3% |
| Interquartile 25% (IQ1) | 2.1% | 2.0% |
| Interquartile 75% (IQ3) | 2.5% | 2.8% |
| Interquartile Range (IQR) | 0.44% | 0.78% |
| Standard Deviation (Sample) | 2.4% | 0.95% |
| Standard Deviation (Population) | 2.4% | 0.94% |
Similar Demographics by Self-Care Disability
Demographics Similar to Immigrants from Asia by Self-Care Disability
In terms of self-care disability, the demographic groups most similar to Immigrants from Asia are Macedonian (2.4%, a difference of 0.010%), Immigrants from Latvia (2.4%, a difference of 0.050%), Immigrants from Chile (2.4%, a difference of 0.060%), Swiss (2.4%, a difference of 0.10%), and Immigrants from Poland (2.4%, a difference of 0.19%).
| Demographics | Rating | Rank | Self-Care Disability |
| Lithuanians | 98.0 /100 | #88 | Exceptional 2.4% |
| Immigrants | Congo | 98.0 /100 | #89 | Exceptional 2.4% |
| Immigrants | Czechoslovakia | 97.7 /100 | #90 | Exceptional 2.4% |
| Immigrants | Jordan | 97.7 /100 | #91 | Exceptional 2.4% |
| Icelanders | 97.4 /100 | #92 | Exceptional 2.4% |
| Immigrants | Latvia | 97.0 /100 | #93 | Exceptional 2.4% |
| Macedonians | 96.9 /100 | #94 | Exceptional 2.4% |
| Immigrants | Asia | 96.9 /100 | #95 | Exceptional 2.4% |
| Immigrants | Chile | 96.7 /100 | #96 | Exceptional 2.4% |
| Swiss | 96.6 /100 | #97 | Exceptional 2.4% |
| Immigrants | Poland | 96.4 /100 | #98 | Exceptional 2.4% |
| Immigrants | Israel | 96.1 /100 | #99 | Exceptional 2.4% |
| Europeans | 95.8 /100 | #100 | Exceptional 2.4% |
| Immigrants | Scotland | 95.7 /100 | #101 | Exceptional 2.4% |
| Croatians | 95.0 /100 | #102 | Exceptional 2.4% |
Demographics Similar to Immigrants from Pakistan by Self-Care Disability
In terms of self-care disability, the demographic groups most similar to Immigrants from Pakistan are Immigrants from South Africa (2.3%, a difference of 0.040%), Immigrants from Uganda (2.3%, a difference of 0.050%), Norwegian (2.3%, a difference of 0.090%), Immigrants from Sudan (2.3%, a difference of 0.14%), and Czech (2.3%, a difference of 0.17%).
| Demographics | Rating | Rank | Self-Care Disability |
| Immigrants | Lithuania | 99.9 /100 | #36 | Exceptional 2.3% |
| Immigrants | Sweden | 99.9 /100 | #37 | Exceptional 2.3% |
| Immigrants | Eastern Africa | 99.9 /100 | #38 | Exceptional 2.3% |
| Immigrants | Bulgaria | 99.8 /100 | #39 | Exceptional 2.3% |
| Iranians | 99.8 /100 | #40 | Exceptional 2.3% |
| Immigrants | Sudan | 99.8 /100 | #41 | Exceptional 2.3% |
| Immigrants | Uganda | 99.8 /100 | #42 | Exceptional 2.3% |
| Immigrants | Pakistan | 99.8 /100 | #43 | Exceptional 2.3% |
| Immigrants | South Africa | 99.8 /100 | #44 | Exceptional 2.3% |
| Norwegians | 99.8 /100 | #45 | Exceptional 2.3% |
| Czechs | 99.8 /100 | #46 | Exceptional 2.3% |
| Jordanians | 99.7 /100 | #47 | Exceptional 2.3% |
| Immigrants | Malaysia | 99.7 /100 | #48 | Exceptional 2.3% |
| Latvians | 99.7 /100 | #49 | Exceptional 2.3% |
| Immigrants | Brazil | 99.7 /100 | #50 | Exceptional 2.3% |