Subsaharan African vs Native/Alaskan Unemployment Among Women with Children Under 18 years
COMPARE
Subsaharan African
Native/Alaskan
Unemployment Among Women with Children Under 18 years
Unemployment Among Women with Children Under 18 years Comparison
Sub-Saharan Africans
Natives/Alaskans
6.2%
UNEMPLOYMENT AMONG WOMEN WITH CHILDREN UNDER 18 YEARS
0.1/ 100
METRIC RATING
266th/ 347
METRIC RANK
7.2%
UNEMPLOYMENT AMONG WOMEN WITH CHILDREN UNDER 18 YEARS
0.0/ 100
METRIC RATING
328th/ 347
METRIC RANK
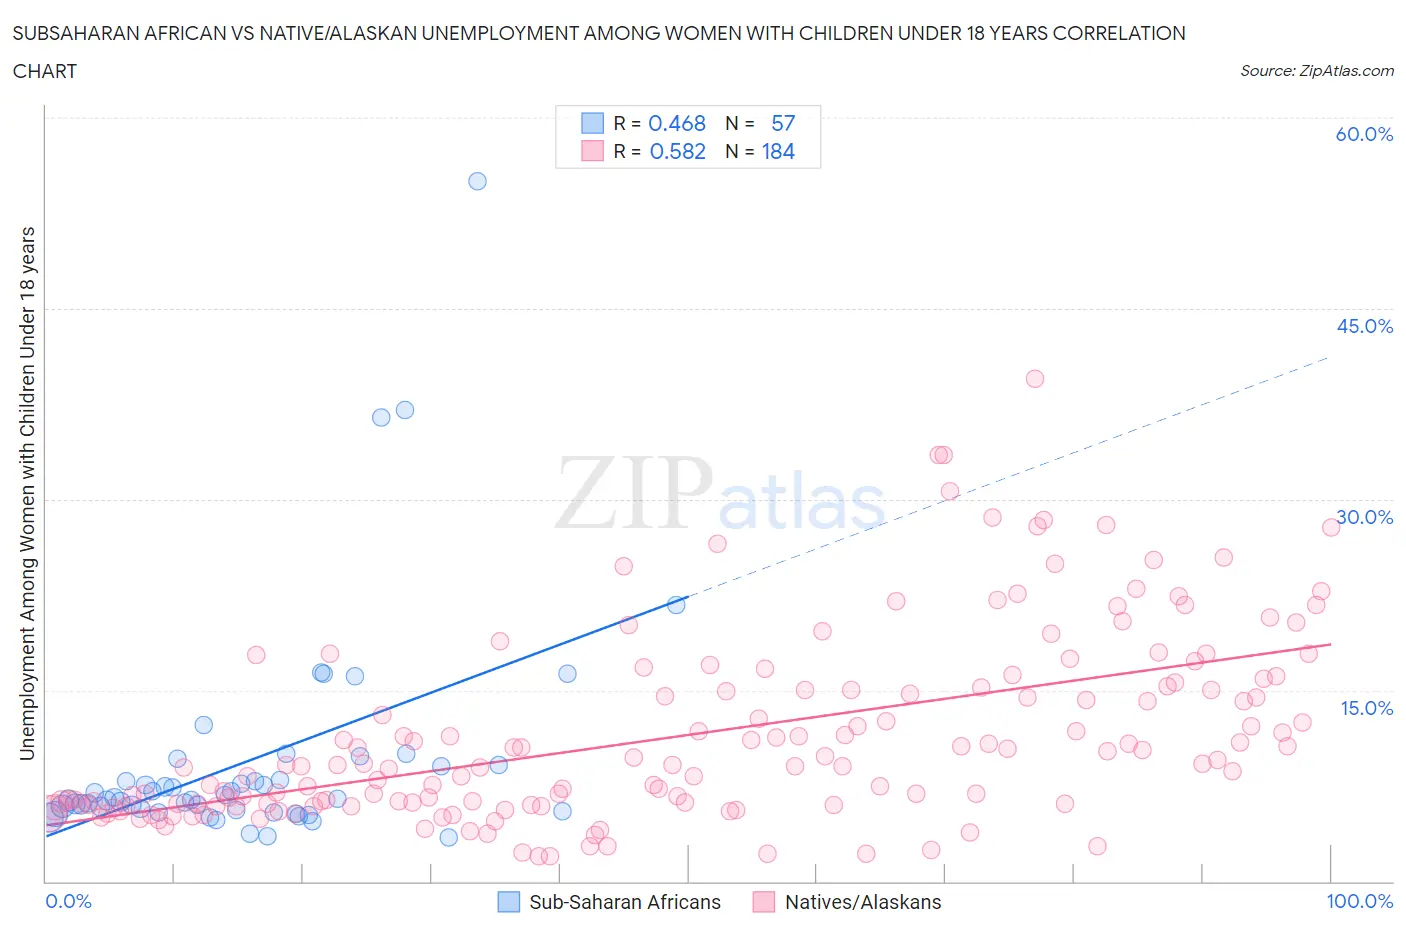
Subsaharan African vs Native/Alaskan Unemployment Among Women with Children Under 18 years Correlation Chart
The statistical analysis conducted on geographies consisting of 479,418,047 people shows a moderate positive correlation between the proportion of Sub-Saharan Africans and unemployment rate among women with children under the age of 18 in the United States with a correlation coefficient (R) of 0.468 and weighted average of 6.2%. Similarly, the statistical analysis conducted on geographies consisting of 478,925,590 people shows a substantial positive correlation between the proportion of Natives/Alaskans and unemployment rate among women with children under the age of 18 in the United States with a correlation coefficient (R) of 0.582 and weighted average of 7.2%, a difference of 17.5%.
Unemployment Among Women with Children Under 18 years Correlation Summary
| Measurement | Subsaharan African | Native/Alaskan |
| Minimum | 3.4% | 1.9% |
| Maximum | 55.0% | 39.5% |
| Range | 51.6% | 37.5% |
| Mean | 9.5% | 11.4% |
| Median | 6.5% | 9.1% |
| Interquartile 25% (IQ1) | 5.5% | 6.0% |
| Interquartile 75% (IQ3) | 9.1% | 15.1% |
| Interquartile Range (IQR) | 3.5% | 9.1% |
| Standard Deviation (Sample) | 8.9% | 7.3% |
| Standard Deviation (Population) | 8.8% | 7.3% |
Similar Demographics by Unemployment Among Women with Children Under 18 years
Demographics Similar to Sub-Saharan Africans by Unemployment Among Women with Children Under 18 years
In terms of unemployment among women with children under 18 years, the demographic groups most similar to Sub-Saharan Africans are French American Indian (6.2%, a difference of 0.010%), Trinidadian and Tobagonian (6.2%, a difference of 0.030%), Cajun (6.2%, a difference of 0.070%), Ghanaian (6.2%, a difference of 0.070%), and Immigrants from Bahamas (6.1%, a difference of 0.33%).
| Demographics | Rating | Rank | Unemployment Among Women with Children Under 18 years |
| Ottawa | 0.1 /100 | #259 | Tragic 6.1% |
| Nigerians | 0.1 /100 | #260 | Tragic 6.1% |
| Immigrants | Liberia | 0.1 /100 | #261 | Tragic 6.1% |
| Immigrants | Trinidad and Tobago | 0.1 /100 | #262 | Tragic 6.1% |
| Spanish American Indians | 0.1 /100 | #263 | Tragic 6.1% |
| Comanche | 0.1 /100 | #264 | Tragic 6.1% |
| Immigrants | Bahamas | 0.1 /100 | #265 | Tragic 6.1% |
| Sub-Saharan Africans | 0.1 /100 | #266 | Tragic 6.2% |
| French American Indians | 0.1 /100 | #267 | Tragic 6.2% |
| Trinidadians and Tobagonians | 0.1 /100 | #268 | Tragic 6.2% |
| Cajuns | 0.1 /100 | #269 | Tragic 6.2% |
| Ghanaians | 0.1 /100 | #270 | Tragic 6.2% |
| Central Americans | 0.0 /100 | #271 | Tragic 6.2% |
| Salvadorans | 0.0 /100 | #272 | Tragic 6.2% |
| Immigrants | Western Africa | 0.0 /100 | #273 | Tragic 6.2% |
Demographics Similar to Natives/Alaskans by Unemployment Among Women with Children Under 18 years
In terms of unemployment among women with children under 18 years, the demographic groups most similar to Natives/Alaskans are Black/African American (7.3%, a difference of 0.41%), Colville (7.4%, a difference of 1.9%), Lumbee (7.1%, a difference of 2.4%), Hopi (7.4%, a difference of 2.4%), and Dominican (7.5%, a difference of 3.0%).
| Demographics | Rating | Rank | Unemployment Among Women with Children Under 18 years |
| U.S. Virgin Islanders | 0.0 /100 | #321 | Tragic 6.7% |
| Houma | 0.0 /100 | #322 | Tragic 6.8% |
| Pueblo | 0.0 /100 | #323 | Tragic 6.8% |
| Paiute | 0.0 /100 | #324 | Tragic 6.9% |
| Immigrants | Dominica | 0.0 /100 | #325 | Tragic 7.0% |
| Chippewa | 0.0 /100 | #326 | Tragic 7.0% |
| Lumbee | 0.0 /100 | #327 | Tragic 7.1% |
| Natives/Alaskans | 0.0 /100 | #328 | Tragic 7.2% |
| Blacks/African Americans | 0.0 /100 | #329 | Tragic 7.3% |
| Colville | 0.0 /100 | #330 | Tragic 7.4% |
| Hopi | 0.0 /100 | #331 | Tragic 7.4% |
| Dominicans | 0.0 /100 | #332 | Tragic 7.5% |
| Immigrants | Dominican Republic | 0.0 /100 | #333 | Tragic 7.5% |
| Cheyenne | 0.0 /100 | #334 | Tragic 7.8% |
| Apache | 0.0 /100 | #335 | Tragic 7.9% |