Subsaharan African vs Inupiat Cognitive Disability
COMPARE
Subsaharan African
Inupiat
Cognitive Disability
Cognitive Disability Comparison
Sub-Saharan Africans
Inupiat
18.5%
COGNITIVE DISABILITY
0.0/ 100
METRIC RATING
314th/ 347
METRIC RANK
16.9%
COGNITIVE DISABILITY
96.5/ 100
METRIC RATING
116th/ 347
METRIC RANK
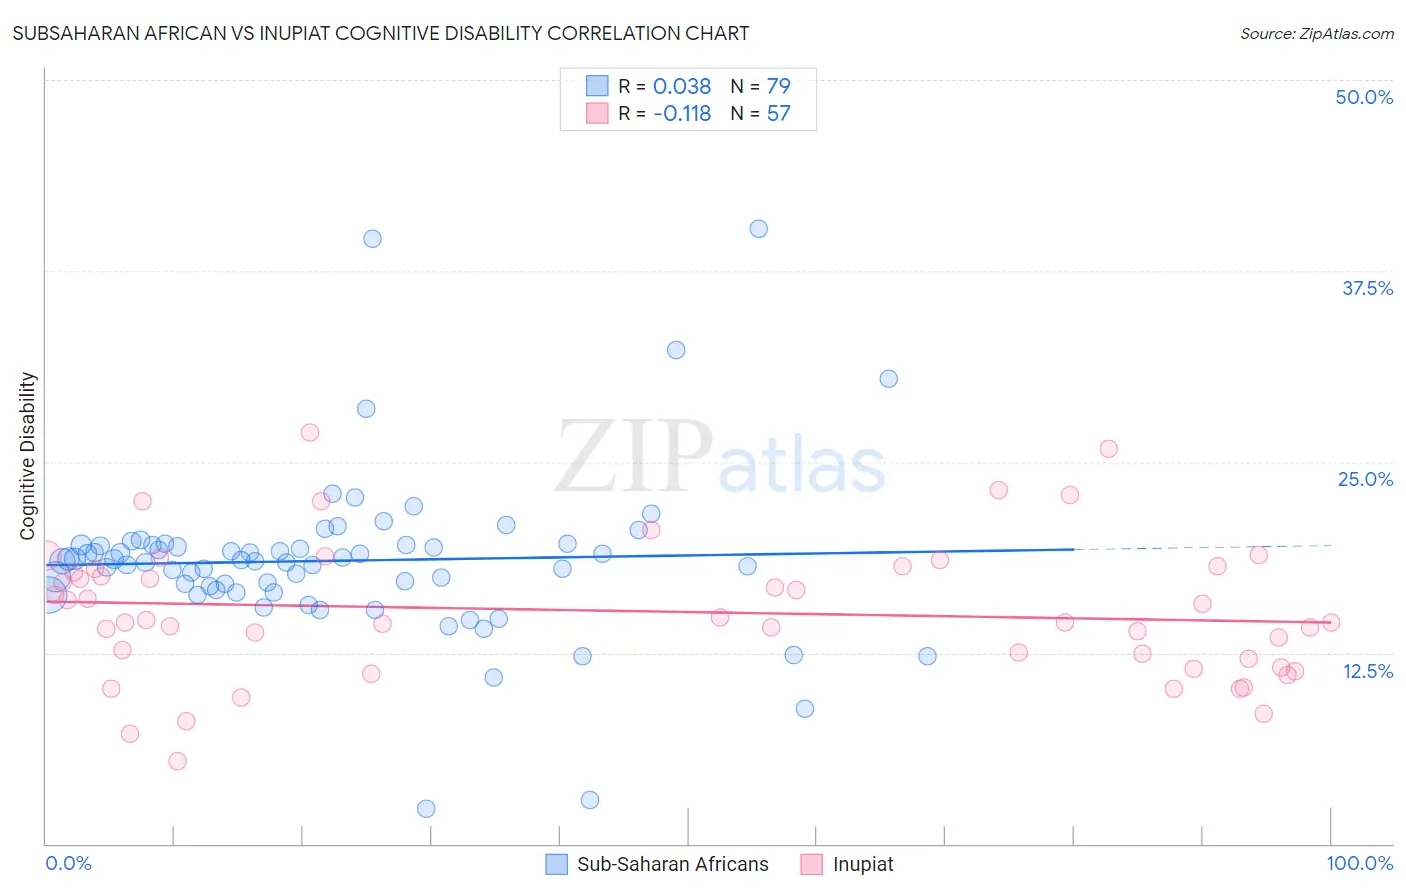
Subsaharan African vs Inupiat Cognitive Disability Correlation Chart
The statistical analysis conducted on geographies consisting of 508,099,215 people shows no correlation between the proportion of Sub-Saharan Africans and percentage of population with cognitive disability in the United States with a correlation coefficient (R) of 0.038 and weighted average of 18.5%. Similarly, the statistical analysis conducted on geographies consisting of 96,337,062 people shows a poor negative correlation between the proportion of Inupiat and percentage of population with cognitive disability in the United States with a correlation coefficient (R) of -0.118 and weighted average of 16.9%, a difference of 9.8%.
Cognitive Disability Correlation Summary
| Measurement | Subsaharan African | Inupiat |
| Minimum | 2.3% | 5.4% |
| Maximum | 40.3% | 26.9% |
| Range | 38.0% | 21.6% |
| Mean | 18.5% | 15.2% |
| Median | 18.5% | 14.5% |
| Interquartile 25% (IQ1) | 16.6% | 11.8% |
| Interquartile 75% (IQ3) | 19.6% | 18.1% |
| Interquartile Range (IQR) | 2.9% | 6.2% |
| Standard Deviation (Sample) | 5.5% | 4.5% |
| Standard Deviation (Population) | 5.5% | 4.5% |
Similar Demographics by Cognitive Disability
Demographics Similar to Sub-Saharan Africans by Cognitive Disability
In terms of cognitive disability, the demographic groups most similar to Sub-Saharan Africans are Yaqui (18.5%, a difference of 0.060%), Chickasaw (18.5%, a difference of 0.17%), Immigrants from Dominica (18.6%, a difference of 0.18%), Immigrants from Middle Africa (18.6%, a difference of 0.26%), and Liberian (18.6%, a difference of 0.34%).
| Demographics | Rating | Rank | Cognitive Disability |
| Ugandans | 0.0 /100 | #307 | Tragic 18.3% |
| Immigrants | Western Africa | 0.0 /100 | #308 | Tragic 18.4% |
| Immigrants | Eastern Africa | 0.0 /100 | #309 | Tragic 18.4% |
| Choctaw | 0.0 /100 | #310 | Tragic 18.4% |
| Hmong | 0.0 /100 | #311 | Tragic 18.4% |
| Chickasaw | 0.0 /100 | #312 | Tragic 18.5% |
| Yaqui | 0.0 /100 | #313 | Tragic 18.5% |
| Sub-Saharan Africans | 0.0 /100 | #314 | Tragic 18.5% |
| Immigrants | Dominica | 0.0 /100 | #315 | Tragic 18.6% |
| Immigrants | Middle Africa | 0.0 /100 | #316 | Tragic 18.6% |
| Liberians | 0.0 /100 | #317 | Tragic 18.6% |
| Bangladeshis | 0.0 /100 | #318 | Tragic 18.6% |
| Comanche | 0.0 /100 | #319 | Tragic 18.6% |
| Apache | 0.0 /100 | #320 | Tragic 18.6% |
| Africans | 0.0 /100 | #321 | Tragic 18.6% |
Demographics Similar to Inupiat by Cognitive Disability
In terms of cognitive disability, the demographic groups most similar to Inupiat are Immigrants from Japan (16.9%, a difference of 0.050%), Immigrants from Denmark (16.9%, a difference of 0.060%), Yup'ik (16.9%, a difference of 0.10%), Immigrants from Sri Lanka (16.8%, a difference of 0.15%), and Korean (16.8%, a difference of 0.15%).
| Demographics | Rating | Rank | Cognitive Disability |
| Albanians | 97.3 /100 | #109 | Exceptional 16.8% |
| Arapaho | 97.3 /100 | #110 | Exceptional 16.8% |
| Uruguayans | 97.2 /100 | #111 | Exceptional 16.8% |
| Indians (Asian) | 97.2 /100 | #112 | Exceptional 16.8% |
| Immigrants | Sri Lanka | 97.1 /100 | #113 | Exceptional 16.8% |
| Koreans | 97.1 /100 | #114 | Exceptional 16.8% |
| Yup'ik | 96.9 /100 | #115 | Exceptional 16.9% |
| Inupiat | 96.5 /100 | #116 | Exceptional 16.9% |
| Immigrants | Japan | 96.2 /100 | #117 | Exceptional 16.9% |
| Immigrants | Denmark | 96.2 /100 | #118 | Exceptional 16.9% |
| South Africans | 95.5 /100 | #119 | Exceptional 16.9% |
| Scottish | 95.0 /100 | #120 | Exceptional 16.9% |
| Immigrants | China | 94.9 /100 | #121 | Exceptional 16.9% |
| Immigrants | Western Europe | 94.8 /100 | #122 | Exceptional 16.9% |
| Portuguese | 94.7 /100 | #123 | Exceptional 16.9% |