Barbadian vs Inupiat Cognitive Disability
COMPARE
Barbadian
Inupiat
Cognitive Disability
Cognitive Disability Comparison
Barbadians
Inupiat
18.3%
COGNITIVE DISABILITY
0.0/ 100
METRIC RATING
302nd/ 347
METRIC RANK
16.9%
COGNITIVE DISABILITY
96.5/ 100
METRIC RATING
116th/ 347
METRIC RANK
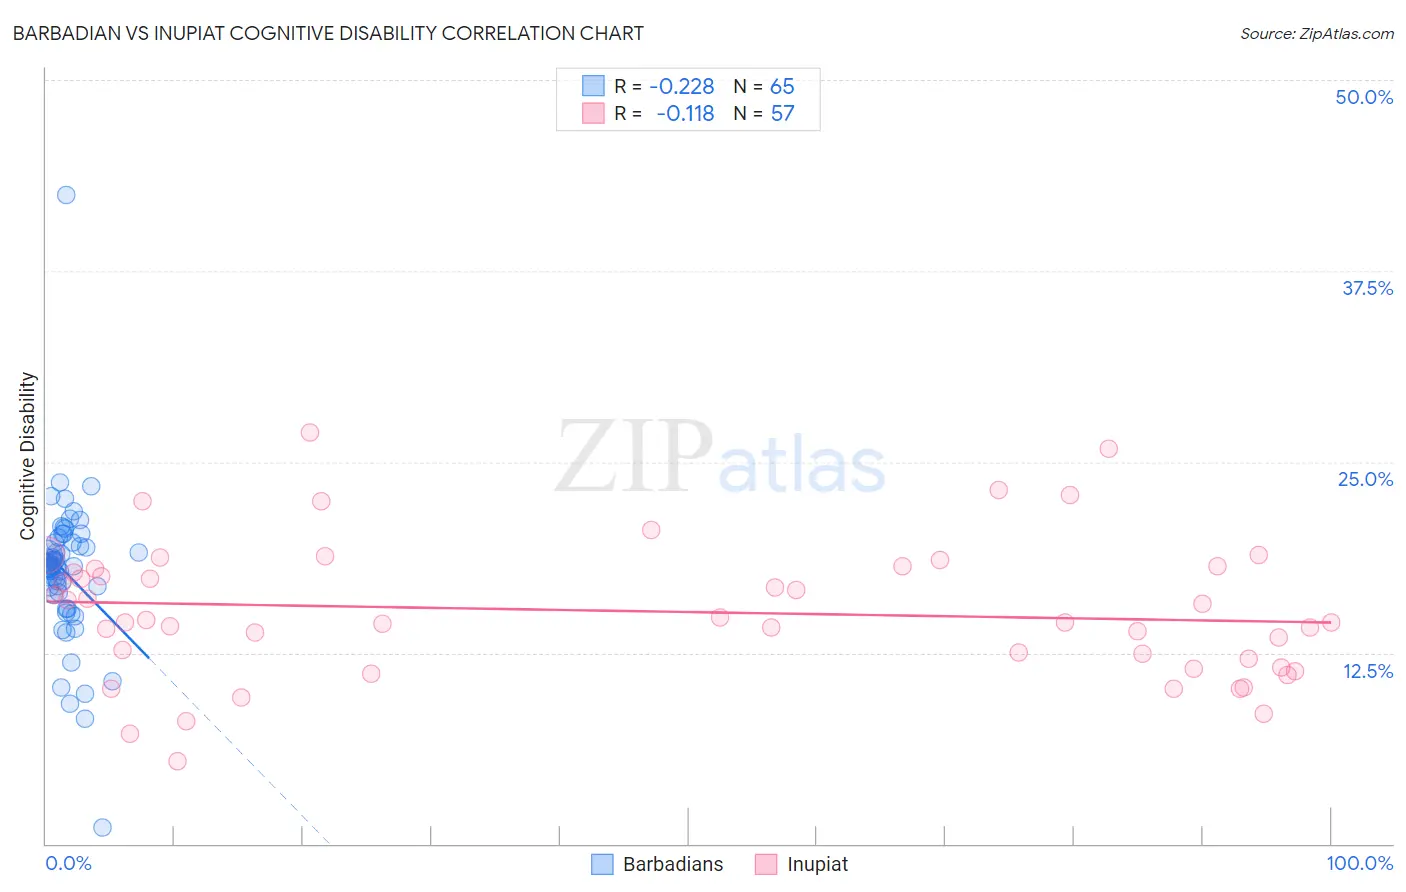
Barbadian vs Inupiat Cognitive Disability Correlation Chart
The statistical analysis conducted on geographies consisting of 141,302,702 people shows a weak negative correlation between the proportion of Barbadians and percentage of population with cognitive disability in the United States with a correlation coefficient (R) of -0.228 and weighted average of 18.3%. Similarly, the statistical analysis conducted on geographies consisting of 96,337,062 people shows a poor negative correlation between the proportion of Inupiat and percentage of population with cognitive disability in the United States with a correlation coefficient (R) of -0.118 and weighted average of 16.9%, a difference of 8.6%.
Cognitive Disability Correlation Summary
| Measurement | Barbadian | Inupiat |
| Minimum | 1.0% | 5.4% |
| Maximum | 42.5% | 26.9% |
| Range | 41.4% | 21.6% |
| Mean | 17.8% | 15.2% |
| Median | 18.2% | 14.5% |
| Interquartile 25% (IQ1) | 16.3% | 11.8% |
| Interquartile 75% (IQ3) | 19.7% | 18.1% |
| Interquartile Range (IQR) | 3.4% | 6.2% |
| Standard Deviation (Sample) | 5.0% | 4.5% |
| Standard Deviation (Population) | 4.9% | 4.5% |
Similar Demographics by Cognitive Disability
Demographics Similar to Barbadians by Cognitive Disability
In terms of cognitive disability, the demographic groups most similar to Barbadians are Immigrants from Kenya (18.3%, a difference of 0.010%), Immigrants from Eritrea (18.3%, a difference of 0.060%), Immigrants from Ghana (18.3%, a difference of 0.080%), Colville (18.3%, a difference of 0.18%), and Seminole (18.3%, a difference of 0.19%).
| Demographics | Rating | Rank | Cognitive Disability |
| German Russians | 0.0 /100 | #295 | Tragic 18.2% |
| Immigrants | Burma/Myanmar | 0.0 /100 | #296 | Tragic 18.2% |
| Blackfeet | 0.0 /100 | #297 | Tragic 18.3% |
| Japanese | 0.0 /100 | #298 | Tragic 18.3% |
| Ghanaians | 0.0 /100 | #299 | Tragic 18.3% |
| Creek | 0.0 /100 | #300 | Tragic 18.3% |
| Immigrants | Ghana | 0.0 /100 | #301 | Tragic 18.3% |
| Barbadians | 0.0 /100 | #302 | Tragic 18.3% |
| Immigrants | Kenya | 0.0 /100 | #303 | Tragic 18.3% |
| Immigrants | Eritrea | 0.0 /100 | #304 | Tragic 18.3% |
| Colville | 0.0 /100 | #305 | Tragic 18.3% |
| Seminole | 0.0 /100 | #306 | Tragic 18.3% |
| Ugandans | 0.0 /100 | #307 | Tragic 18.3% |
| Immigrants | Western Africa | 0.0 /100 | #308 | Tragic 18.4% |
| Immigrants | Eastern Africa | 0.0 /100 | #309 | Tragic 18.4% |
Demographics Similar to Inupiat by Cognitive Disability
In terms of cognitive disability, the demographic groups most similar to Inupiat are Immigrants from Japan (16.9%, a difference of 0.050%), Immigrants from Denmark (16.9%, a difference of 0.060%), Yup'ik (16.9%, a difference of 0.10%), Immigrants from Sri Lanka (16.8%, a difference of 0.15%), and Korean (16.8%, a difference of 0.15%).
| Demographics | Rating | Rank | Cognitive Disability |
| Albanians | 97.3 /100 | #109 | Exceptional 16.8% |
| Arapaho | 97.3 /100 | #110 | Exceptional 16.8% |
| Uruguayans | 97.2 /100 | #111 | Exceptional 16.8% |
| Indians (Asian) | 97.2 /100 | #112 | Exceptional 16.8% |
| Immigrants | Sri Lanka | 97.1 /100 | #113 | Exceptional 16.8% |
| Koreans | 97.1 /100 | #114 | Exceptional 16.8% |
| Yup'ik | 96.9 /100 | #115 | Exceptional 16.9% |
| Inupiat | 96.5 /100 | #116 | Exceptional 16.9% |
| Immigrants | Japan | 96.2 /100 | #117 | Exceptional 16.9% |
| Immigrants | Denmark | 96.2 /100 | #118 | Exceptional 16.9% |
| South Africans | 95.5 /100 | #119 | Exceptional 16.9% |
| Scottish | 95.0 /100 | #120 | Exceptional 16.9% |
| Immigrants | China | 94.9 /100 | #121 | Exceptional 16.9% |
| Immigrants | Western Europe | 94.8 /100 | #122 | Exceptional 16.9% |
| Portuguese | 94.7 /100 | #123 | Exceptional 16.9% |