Israeli vs Inupiat Cognitive Disability
COMPARE
Israeli
Inupiat
Cognitive Disability
Cognitive Disability Comparison
Israelis
Inupiat
17.0%
COGNITIVE DISABILITY
91.0/ 100
METRIC RATING
136th/ 347
METRIC RANK
16.9%
COGNITIVE DISABILITY
96.5/ 100
METRIC RATING
116th/ 347
METRIC RANK
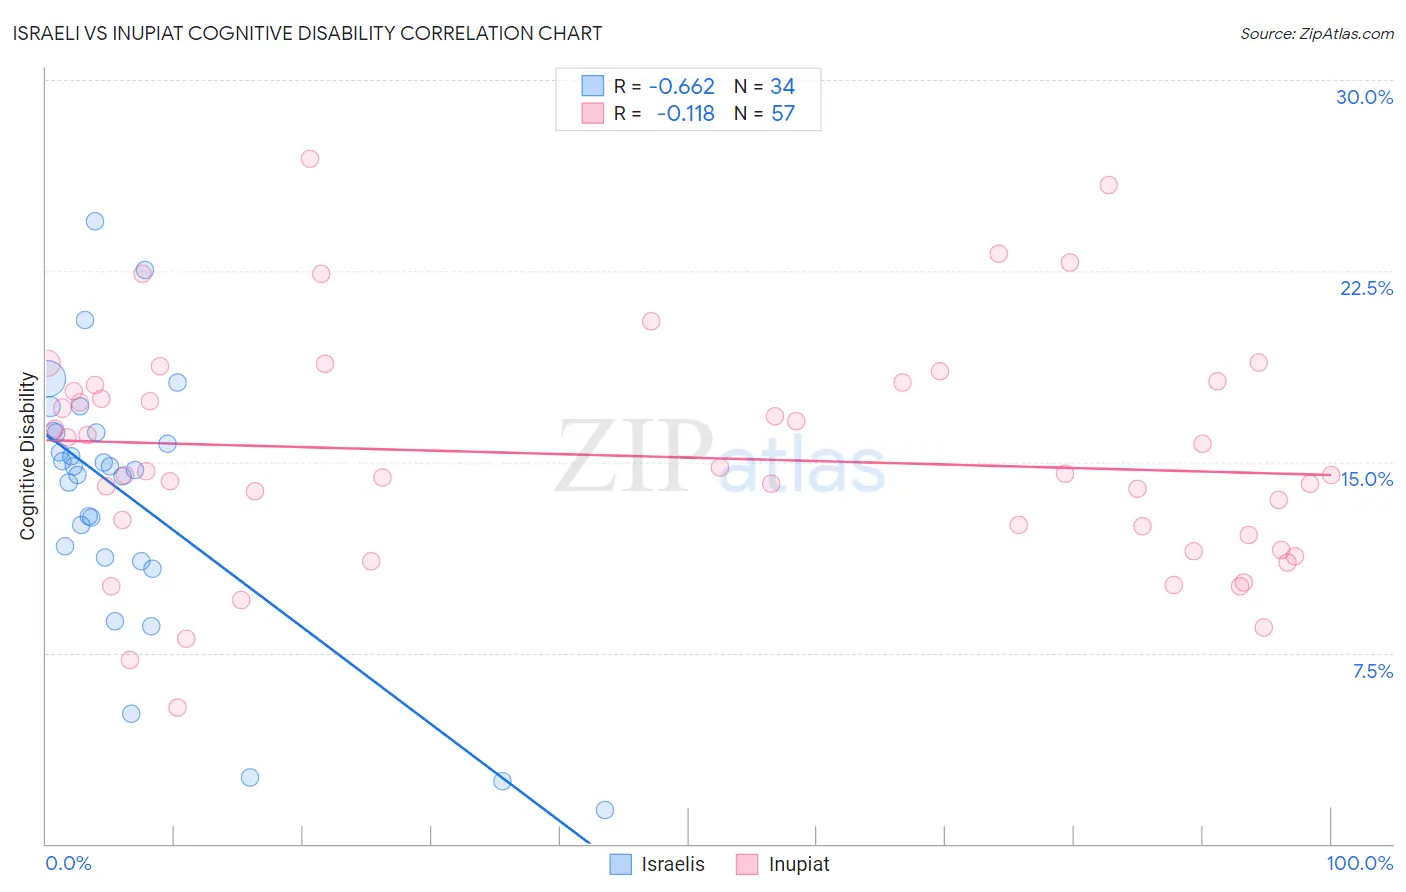
Israeli vs Inupiat Cognitive Disability Correlation Chart
The statistical analysis conducted on geographies consisting of 211,174,000 people shows a significant negative correlation between the proportion of Israelis and percentage of population with cognitive disability in the United States with a correlation coefficient (R) of -0.662 and weighted average of 17.0%. Similarly, the statistical analysis conducted on geographies consisting of 96,337,062 people shows a poor negative correlation between the proportion of Inupiat and percentage of population with cognitive disability in the United States with a correlation coefficient (R) of -0.118 and weighted average of 16.9%, a difference of 0.73%.
Cognitive Disability Correlation Summary
| Measurement | Israeli | Inupiat |
| Minimum | 1.3% | 5.4% |
| Maximum | 24.5% | 26.9% |
| Range | 23.1% | 21.6% |
| Mean | 13.6% | 15.2% |
| Median | 14.7% | 14.5% |
| Interquartile 25% (IQ1) | 11.3% | 11.8% |
| Interquartile 75% (IQ3) | 16.2% | 18.1% |
| Interquartile Range (IQR) | 4.9% | 6.2% |
| Standard Deviation (Sample) | 5.2% | 4.5% |
| Standard Deviation (Population) | 5.1% | 4.5% |
Demographics Similar to Israelis and Inupiat by Cognitive Disability
In terms of cognitive disability, the demographic groups most similar to Israelis are Lebanese (17.0%, a difference of 0.030%), Immigrants from Chile (17.0%, a difference of 0.060%), Immigrants from Jordan (17.0%, a difference of 0.080%), Immigrants from Germany (17.0%, a difference of 0.11%), and White/Caucasian (17.0%, a difference of 0.11%). Similarly, the demographic groups most similar to Inupiat are Immigrants from Japan (16.9%, a difference of 0.050%), Immigrants from Denmark (16.9%, a difference of 0.060%), South African (16.9%, a difference of 0.19%), Scottish (16.9%, a difference of 0.27%), and Immigrants from China (16.9%, a difference of 0.29%).
| Demographics | Rating | Rank | Cognitive Disability |
| Inupiat | 96.5 /100 | #116 | Exceptional 16.9% |
| Immigrants | Japan | 96.2 /100 | #117 | Exceptional 16.9% |
| Immigrants | Denmark | 96.2 /100 | #118 | Exceptional 16.9% |
| South Africans | 95.5 /100 | #119 | Exceptional 16.9% |
| Scottish | 95.0 /100 | #120 | Exceptional 16.9% |
| Immigrants | China | 94.9 /100 | #121 | Exceptional 16.9% |
| Immigrants | Western Europe | 94.8 /100 | #122 | Exceptional 16.9% |
| Portuguese | 94.7 /100 | #123 | Exceptional 16.9% |
| Turks | 94.5 /100 | #124 | Exceptional 16.9% |
| Scandinavians | 94.1 /100 | #125 | Exceptional 16.9% |
| Europeans | 93.4 /100 | #126 | Exceptional 17.0% |
| Immigrants | Costa Rica | 93.1 /100 | #127 | Exceptional 17.0% |
| Nicaraguans | 93.0 /100 | #128 | Exceptional 17.0% |
| Immigrants | Uruguay | 92.9 /100 | #129 | Exceptional 17.0% |
| Immigrants | Vietnam | 92.4 /100 | #130 | Exceptional 17.0% |
| Immigrants | Germany | 92.1 /100 | #131 | Exceptional 17.0% |
| Whites/Caucasians | 92.1 /100 | #132 | Exceptional 17.0% |
| Immigrants | Jordan | 91.9 /100 | #133 | Exceptional 17.0% |
| Immigrants | Chile | 91.7 /100 | #134 | Exceptional 17.0% |
| Lebanese | 91.3 /100 | #135 | Exceptional 17.0% |
| Israelis | 91.0 /100 | #136 | Exceptional 17.0% |