Subsaharan African vs Inupiat 7th Grade
COMPARE
Subsaharan African
Inupiat
7th Grade
7th Grade Comparison
Sub-Saharan Africans
Inupiat
95.7%
7TH GRADE
7.2/ 100
METRIC RATING
220th/ 347
METRIC RANK
97.4%
7TH GRADE
100.0/ 100
METRIC RATING
21st/ 347
METRIC RANK
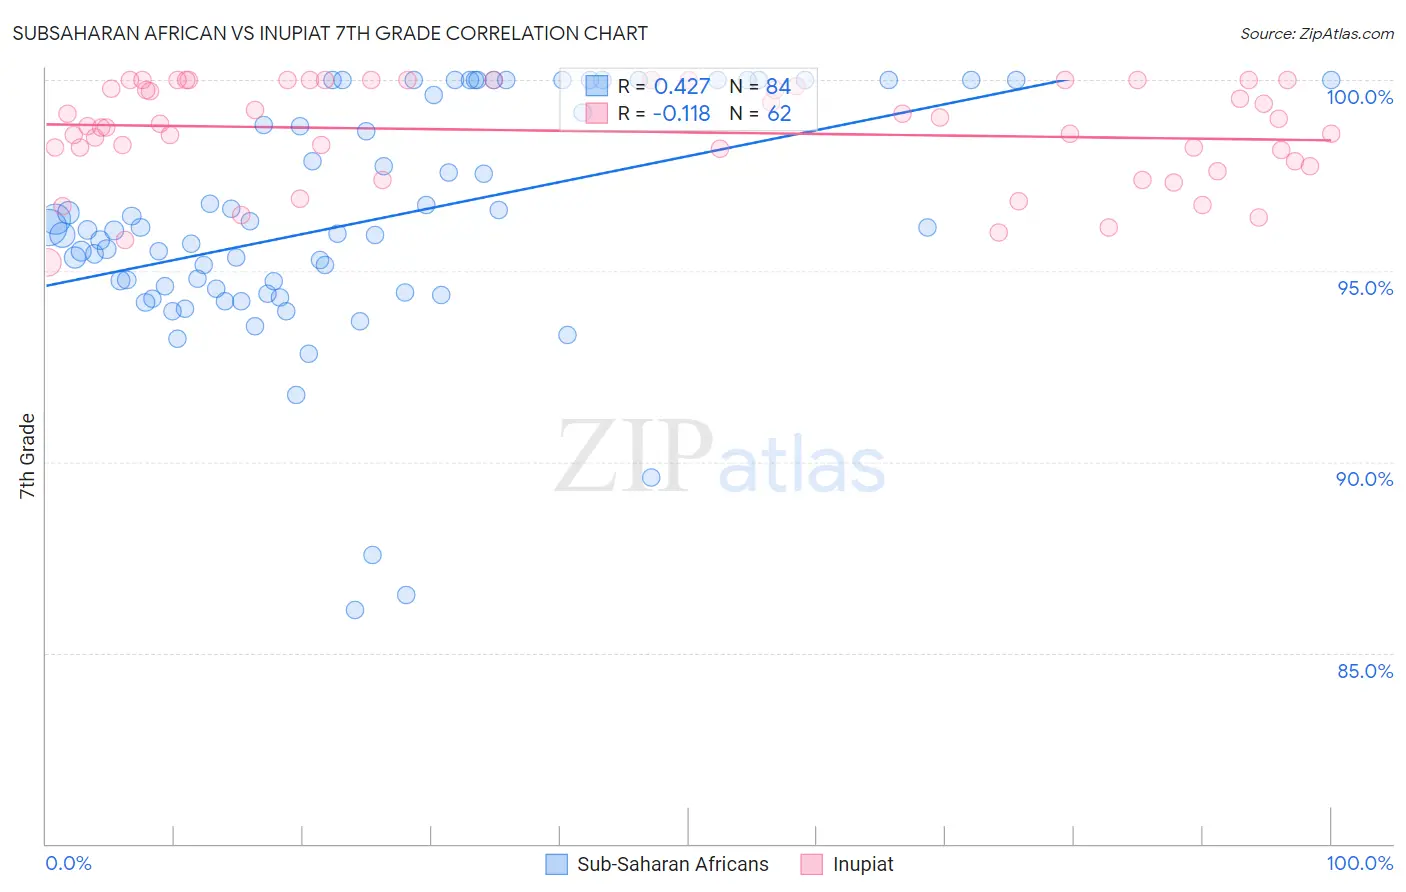
Subsaharan African vs Inupiat 7th Grade Correlation Chart
The statistical analysis conducted on geographies consisting of 508,210,020 people shows a moderate positive correlation between the proportion of Sub-Saharan Africans and percentage of population with at least 7th grade education in the United States with a correlation coefficient (R) of 0.427 and weighted average of 95.7%. Similarly, the statistical analysis conducted on geographies consisting of 96,348,974 people shows a poor negative correlation between the proportion of Inupiat and percentage of population with at least 7th grade education in the United States with a correlation coefficient (R) of -0.118 and weighted average of 97.4%, a difference of 1.8%.
7th Grade Correlation Summary
| Measurement | Subsaharan African | Inupiat |
| Minimum | 86.1% | 95.2% |
| Maximum | 100.0% | 100.0% |
| Range | 13.9% | 4.8% |
| Mean | 96.3% | 98.7% |
| Median | 96.1% | 98.8% |
| Interquartile 25% (IQ1) | 94.5% | 97.9% |
| Interquartile 75% (IQ3) | 99.8% | 100.0% |
| Interquartile Range (IQR) | 5.3% | 2.1% |
| Standard Deviation (Sample) | 3.1% | 1.3% |
| Standard Deviation (Population) | 3.1% | 1.3% |
Similar Demographics by 7th Grade
Demographics Similar to Sub-Saharan Africans by 7th Grade
In terms of 7th grade, the demographic groups most similar to Sub-Saharan Africans are Samoan (95.7%, a difference of 0.0%), Laotian (95.7%, a difference of 0.010%), Immigrants from Syria (95.7%, a difference of 0.010%), Immigrants from Oceania (95.7%, a difference of 0.010%), and Immigrants from Liberia (95.7%, a difference of 0.020%).
| Demographics | Rating | Rank | 7th Grade |
| Immigrants | Morocco | 12.6 /100 | #213 | Poor 95.8% |
| Bahamians | 11.6 /100 | #214 | Poor 95.7% |
| Spanish Americans | 9.3 /100 | #215 | Tragic 95.7% |
| Immigrants | Chile | 9.1 /100 | #216 | Tragic 95.7% |
| Immigrants | Pakistan | 9.0 /100 | #217 | Tragic 95.7% |
| Immigrants | Liberia | 8.1 /100 | #218 | Tragic 95.7% |
| Immigrants | Southern Europe | 7.9 /100 | #219 | Tragic 95.7% |
| Sub-Saharan Africans | 7.2 /100 | #220 | Tragic 95.7% |
| Samoans | 7.0 /100 | #221 | Tragic 95.7% |
| Laotians | 6.8 /100 | #222 | Tragic 95.7% |
| Immigrants | Syria | 6.7 /100 | #223 | Tragic 95.7% |
| Immigrants | Oceania | 6.7 /100 | #224 | Tragic 95.7% |
| Immigrants | Malaysia | 6.2 /100 | #225 | Tragic 95.6% |
| Immigrants | Eastern Asia | 5.8 /100 | #226 | Tragic 95.6% |
| Immigrants | Western Asia | 5.4 /100 | #227 | Tragic 95.6% |
Demographics Similar to Inupiat by 7th Grade
In terms of 7th grade, the demographic groups most similar to Inupiat are French Canadian (97.4%, a difference of 0.0%), Yup'ik (97.4%, a difference of 0.010%), Croatian (97.4%, a difference of 0.020%), Welsh (97.4%, a difference of 0.030%), and French (97.4%, a difference of 0.040%).
| Demographics | Rating | Rank | 7th Grade |
| Pennsylvania Germans | 100.0 /100 | #14 | Exceptional 97.6% |
| English | 100.0 /100 | #15 | Exceptional 97.6% |
| Irish | 100.0 /100 | #16 | Exceptional 97.5% |
| Scottish | 100.0 /100 | #17 | Exceptional 97.5% |
| Tlingit-Haida | 100.0 /100 | #18 | Exceptional 97.5% |
| Lithuanians | 100.0 /100 | #19 | Exceptional 97.5% |
| Yup'ik | 100.0 /100 | #20 | Exceptional 97.4% |
| Inupiat | 100.0 /100 | #21 | Exceptional 97.4% |
| French Canadians | 100.0 /100 | #22 | Exceptional 97.4% |
| Croatians | 100.0 /100 | #23 | Exceptional 97.4% |
| Welsh | 100.0 /100 | #24 | Exceptional 97.4% |
| French | 100.0 /100 | #25 | Exceptional 97.4% |
| Scotch-Irish | 100.0 /100 | #26 | Exceptional 97.4% |
| Danes | 100.0 /100 | #27 | Exceptional 97.4% |
| Sioux | 100.0 /100 | #28 | Exceptional 97.4% |