Menominee vs Inupiat Cognitive Disability
COMPARE
Menominee
Inupiat
Cognitive Disability
Cognitive Disability Comparison
Menominee
Inupiat
18.0%
COGNITIVE DISABILITY
0.4/ 100
METRIC RATING
264th/ 347
METRIC RANK
16.9%
COGNITIVE DISABILITY
96.5/ 100
METRIC RATING
116th/ 347
METRIC RANK
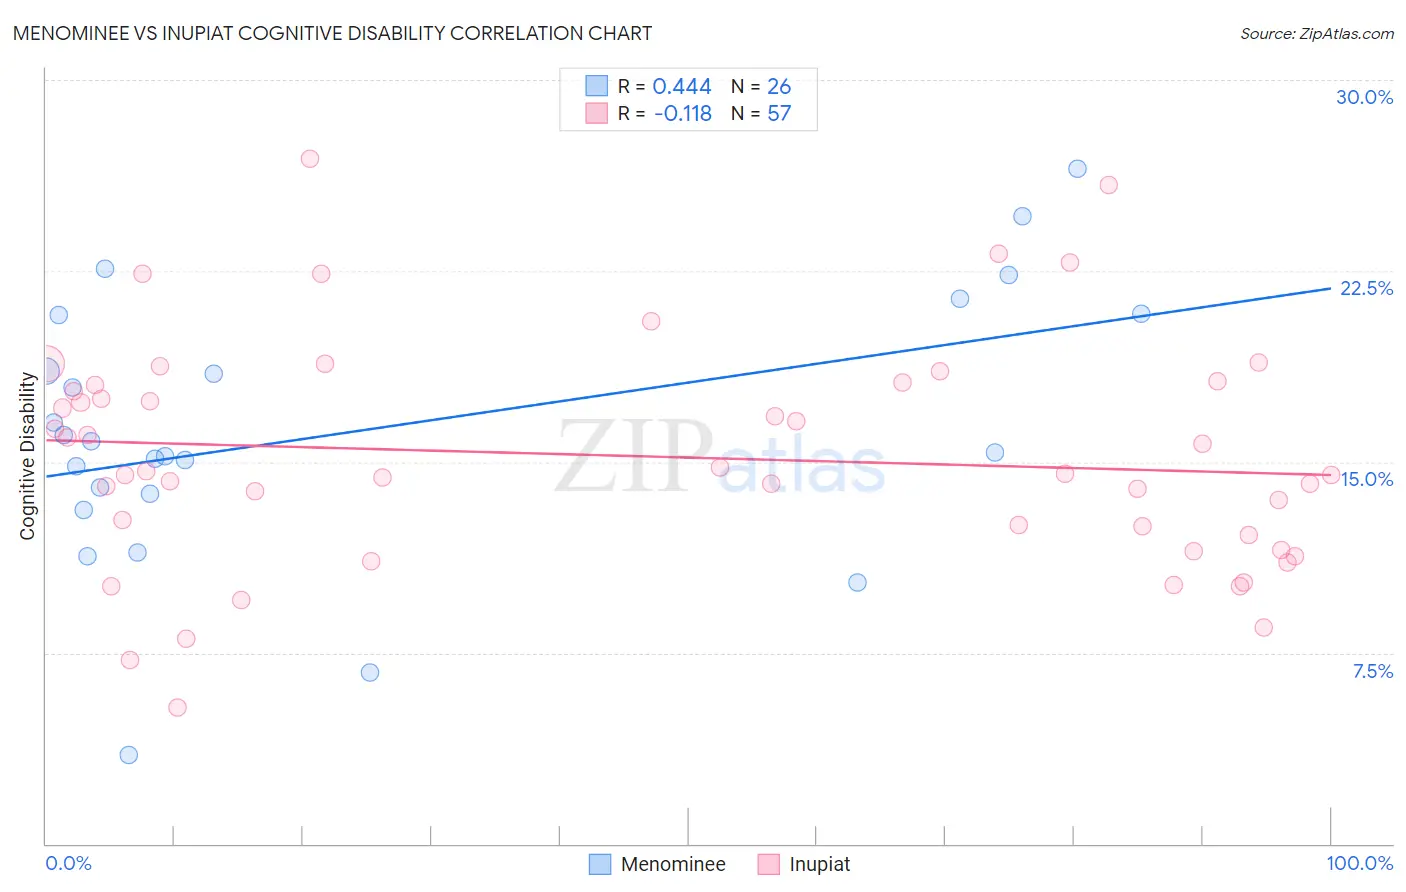
Menominee vs Inupiat Cognitive Disability Correlation Chart
The statistical analysis conducted on geographies consisting of 45,777,849 people shows a moderate positive correlation between the proportion of Menominee and percentage of population with cognitive disability in the United States with a correlation coefficient (R) of 0.444 and weighted average of 18.0%. Similarly, the statistical analysis conducted on geographies consisting of 96,337,062 people shows a poor negative correlation between the proportion of Inupiat and percentage of population with cognitive disability in the United States with a correlation coefficient (R) of -0.118 and weighted average of 16.9%, a difference of 6.5%.
Cognitive Disability Correlation Summary
| Measurement | Menominee | Inupiat |
| Minimum | 3.5% | 5.4% |
| Maximum | 26.5% | 26.9% |
| Range | 23.0% | 21.6% |
| Mean | 16.2% | 15.2% |
| Median | 15.6% | 14.5% |
| Interquartile 25% (IQ1) | 13.7% | 11.8% |
| Interquartile 75% (IQ3) | 20.8% | 18.1% |
| Interquartile Range (IQR) | 7.0% | 6.2% |
| Standard Deviation (Sample) | 5.3% | 4.5% |
| Standard Deviation (Population) | 5.2% | 4.5% |
Similar Demographics by Cognitive Disability
Demographics Similar to Menominee by Cognitive Disability
In terms of cognitive disability, the demographic groups most similar to Menominee are Spanish American (18.0%, a difference of 0.030%), Belizean (18.0%, a difference of 0.030%), Immigrants from Barbados (17.9%, a difference of 0.060%), Nepalese (18.0%, a difference of 0.090%), and Sierra Leonean (17.9%, a difference of 0.10%).
| Demographics | Rating | Rank | Cognitive Disability |
| Mexican American Indians | 0.6 /100 | #257 | Tragic 17.9% |
| Immigrants | Armenia | 0.6 /100 | #258 | Tragic 17.9% |
| Ethiopians | 0.5 /100 | #259 | Tragic 17.9% |
| Immigrants | Belize | 0.5 /100 | #260 | Tragic 17.9% |
| Guamanians/Chamorros | 0.5 /100 | #261 | Tragic 17.9% |
| Sierra Leoneans | 0.4 /100 | #262 | Tragic 17.9% |
| Immigrants | Barbados | 0.4 /100 | #263 | Tragic 17.9% |
| Menominee | 0.4 /100 | #264 | Tragic 18.0% |
| Spanish Americans | 0.4 /100 | #265 | Tragic 18.0% |
| Belizeans | 0.4 /100 | #266 | Tragic 18.0% |
| Nepalese | 0.3 /100 | #267 | Tragic 18.0% |
| Cherokee | 0.3 /100 | #268 | Tragic 18.0% |
| Hondurans | 0.3 /100 | #269 | Tragic 18.0% |
| Immigrants | Bahamas | 0.3 /100 | #270 | Tragic 18.0% |
| Potawatomi | 0.2 /100 | #271 | Tragic 18.0% |
Demographics Similar to Inupiat by Cognitive Disability
In terms of cognitive disability, the demographic groups most similar to Inupiat are Immigrants from Japan (16.9%, a difference of 0.050%), Immigrants from Denmark (16.9%, a difference of 0.060%), Yup'ik (16.9%, a difference of 0.10%), Immigrants from Sri Lanka (16.8%, a difference of 0.15%), and Korean (16.8%, a difference of 0.15%).
| Demographics | Rating | Rank | Cognitive Disability |
| Albanians | 97.3 /100 | #109 | Exceptional 16.8% |
| Arapaho | 97.3 /100 | #110 | Exceptional 16.8% |
| Uruguayans | 97.2 /100 | #111 | Exceptional 16.8% |
| Indians (Asian) | 97.2 /100 | #112 | Exceptional 16.8% |
| Immigrants | Sri Lanka | 97.1 /100 | #113 | Exceptional 16.8% |
| Koreans | 97.1 /100 | #114 | Exceptional 16.8% |
| Yup'ik | 96.9 /100 | #115 | Exceptional 16.9% |
| Inupiat | 96.5 /100 | #116 | Exceptional 16.9% |
| Immigrants | Japan | 96.2 /100 | #117 | Exceptional 16.9% |
| Immigrants | Denmark | 96.2 /100 | #118 | Exceptional 16.9% |
| South Africans | 95.5 /100 | #119 | Exceptional 16.9% |
| Scottish | 95.0 /100 | #120 | Exceptional 16.9% |
| Immigrants | China | 94.9 /100 | #121 | Exceptional 16.9% |
| Immigrants | Western Europe | 94.8 /100 | #122 | Exceptional 16.9% |
| Portuguese | 94.7 /100 | #123 | Exceptional 16.9% |