Subsaharan African vs Nonimmigrants Cognitive Disability
COMPARE
Subsaharan African
Nonimmigrants
Cognitive Disability
Cognitive Disability Comparison
Sub-Saharan Africans
Nonimmigrants
18.5%
COGNITIVE DISABILITY
0.0/ 100
METRIC RATING
314th/ 347
METRIC RANK
17.4%
COGNITIVE DISABILITY
27.4/ 100
METRIC RATING
191st/ 347
METRIC RANK
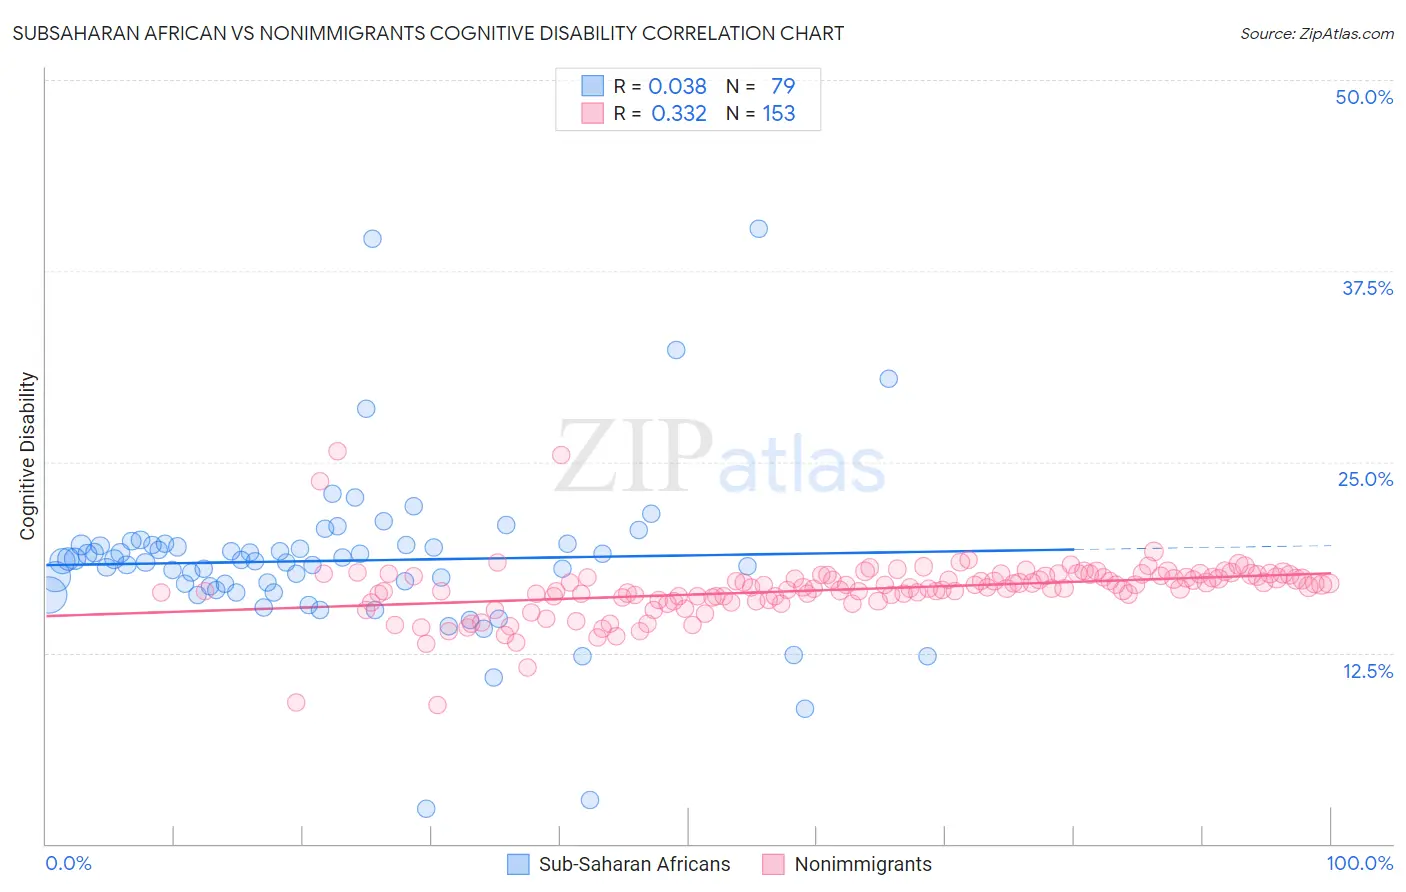
Subsaharan African vs Nonimmigrants Cognitive Disability Correlation Chart
The statistical analysis conducted on geographies consisting of 508,099,215 people shows no correlation between the proportion of Sub-Saharan Africans and percentage of population with cognitive disability in the United States with a correlation coefficient (R) of 0.038 and weighted average of 18.5%. Similarly, the statistical analysis conducted on geographies consisting of 584,976,337 people shows a mild positive correlation between the proportion of Nonimmigrants and percentage of population with cognitive disability in the United States with a correlation coefficient (R) of 0.332 and weighted average of 17.4%, a difference of 6.5%.
Cognitive Disability Correlation Summary
| Measurement | Subsaharan African | Nonimmigrants |
| Minimum | 2.3% | 9.1% |
| Maximum | 40.3% | 25.7% |
| Range | 38.0% | 16.6% |
| Mean | 18.5% | 16.6% |
| Median | 18.5% | 16.8% |
| Interquartile 25% (IQ1) | 16.6% | 16.0% |
| Interquartile 75% (IQ3) | 19.6% | 17.6% |
| Interquartile Range (IQR) | 2.9% | 1.5% |
| Standard Deviation (Sample) | 5.5% | 1.9% |
| Standard Deviation (Population) | 5.5% | 1.9% |
Similar Demographics by Cognitive Disability
Demographics Similar to Sub-Saharan Africans by Cognitive Disability
In terms of cognitive disability, the demographic groups most similar to Sub-Saharan Africans are Yaqui (18.5%, a difference of 0.060%), Chickasaw (18.5%, a difference of 0.17%), Immigrants from Dominica (18.6%, a difference of 0.18%), Immigrants from Middle Africa (18.6%, a difference of 0.26%), and Liberian (18.6%, a difference of 0.34%).
| Demographics | Rating | Rank | Cognitive Disability |
| Ugandans | 0.0 /100 | #307 | Tragic 18.3% |
| Immigrants | Western Africa | 0.0 /100 | #308 | Tragic 18.4% |
| Immigrants | Eastern Africa | 0.0 /100 | #309 | Tragic 18.4% |
| Choctaw | 0.0 /100 | #310 | Tragic 18.4% |
| Hmong | 0.0 /100 | #311 | Tragic 18.4% |
| Chickasaw | 0.0 /100 | #312 | Tragic 18.5% |
| Yaqui | 0.0 /100 | #313 | Tragic 18.5% |
| Sub-Saharan Africans | 0.0 /100 | #314 | Tragic 18.5% |
| Immigrants | Dominica | 0.0 /100 | #315 | Tragic 18.6% |
| Immigrants | Middle Africa | 0.0 /100 | #316 | Tragic 18.6% |
| Liberians | 0.0 /100 | #317 | Tragic 18.6% |
| Bangladeshis | 0.0 /100 | #318 | Tragic 18.6% |
| Comanche | 0.0 /100 | #319 | Tragic 18.6% |
| Apache | 0.0 /100 | #320 | Tragic 18.6% |
| Africans | 0.0 /100 | #321 | Tragic 18.6% |
Demographics Similar to Nonimmigrants by Cognitive Disability
In terms of cognitive disability, the demographic groups most similar to Nonimmigrants are Immigrants from Spain (17.4%, a difference of 0.010%), Immigrants from Haiti (17.4%, a difference of 0.010%), Delaware (17.4%, a difference of 0.060%), Immigrants from Western Asia (17.4%, a difference of 0.070%), and Immigrants from France (17.4%, a difference of 0.080%).
| Demographics | Rating | Rank | Cognitive Disability |
| Crow | 39.1 /100 | #184 | Fair 17.3% |
| Afghans | 38.2 /100 | #185 | Fair 17.3% |
| Cambodians | 35.9 /100 | #186 | Fair 17.3% |
| Immigrants | Fiji | 33.7 /100 | #187 | Fair 17.4% |
| Immigrants | France | 29.8 /100 | #188 | Fair 17.4% |
| Immigrants | Western Asia | 29.5 /100 | #189 | Fair 17.4% |
| Immigrants | Spain | 27.7 /100 | #190 | Fair 17.4% |
| Immigrants | Nonimmigrants | 27.4 /100 | #191 | Fair 17.4% |
| Immigrants | Haiti | 27.1 /100 | #192 | Fair 17.4% |
| Delaware | 25.6 /100 | #193 | Fair 17.4% |
| Immigrants | Bosnia and Herzegovina | 22.0 /100 | #194 | Fair 17.4% |
| New Zealanders | 21.1 /100 | #195 | Fair 17.4% |
| Guyanese | 17.5 /100 | #196 | Poor 17.5% |
| Immigrants | Afghanistan | 16.7 /100 | #197 | Poor 17.5% |
| Immigrants | Panama | 14.8 /100 | #198 | Poor 17.5% |