Subsaharan African vs Immigrants from Norway Unemployment Among Ages 25 to 29 years
COMPARE
Subsaharan African
Immigrants from Norway
Unemployment Among Ages 25 to 29 years
Unemployment Among Ages 25 to 29 years Comparison
Sub-Saharan Africans
Immigrants from Norway
7.2%
UNEMPLOYMENT AMONG AGES 25 TO 29 YEARS
0.6/ 100
METRIC RATING
248th/ 347
METRIC RANK
6.8%
UNEMPLOYMENT AMONG AGES 25 TO 29 YEARS
21.2/ 100
METRIC RATING
203rd/ 347
METRIC RANK
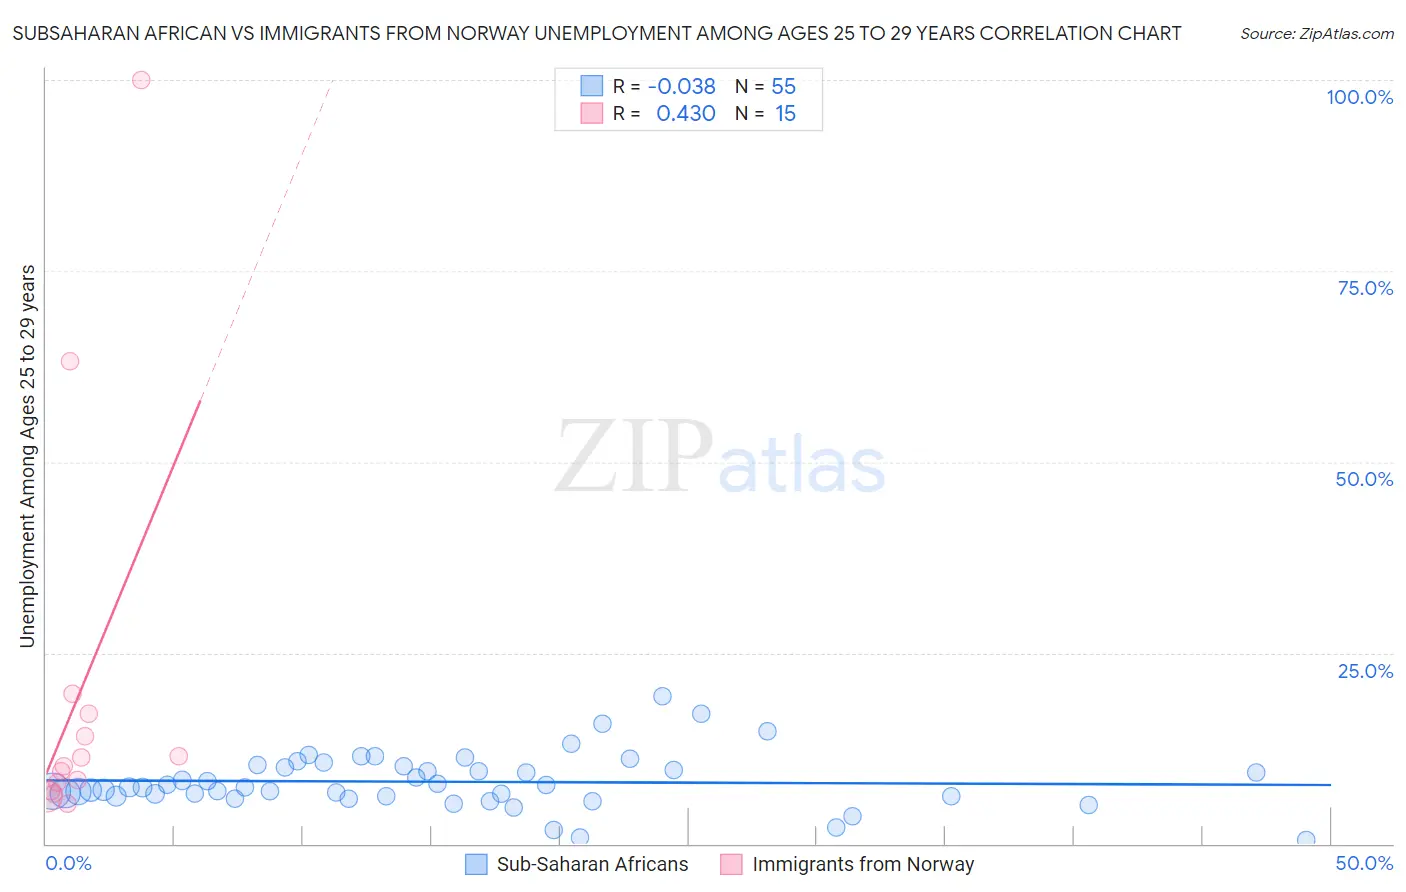
Subsaharan African vs Immigrants from Norway Unemployment Among Ages 25 to 29 years Correlation Chart
The statistical analysis conducted on geographies consisting of 472,657,928 people shows no correlation between the proportion of Sub-Saharan Africans and unemployment rate among population between the ages 25 and 29 in the United States with a correlation coefficient (R) of -0.038 and weighted average of 7.2%. Similarly, the statistical analysis conducted on geographies consisting of 113,962,489 people shows a moderate positive correlation between the proportion of Immigrants from Norway and unemployment rate among population between the ages 25 and 29 in the United States with a correlation coefficient (R) of 0.430 and weighted average of 6.8%, a difference of 5.8%.
Unemployment Among Ages 25 to 29 years Correlation Summary
| Measurement | Subsaharan African | Immigrants from Norway |
| Minimum | 0.50% | 5.2% |
| Maximum | 19.3% | 100.0% |
| Range | 18.8% | 94.8% |
| Mean | 8.1% | 19.8% |
| Median | 7.4% | 10.2% |
| Interquartile 25% (IQ1) | 6.3% | 7.0% |
| Interquartile 75% (IQ3) | 10.1% | 17.1% |
| Interquartile Range (IQR) | 3.8% | 10.1% |
| Standard Deviation (Sample) | 3.6% | 26.3% |
| Standard Deviation (Population) | 3.6% | 25.4% |
Similar Demographics by Unemployment Among Ages 25 to 29 years
Demographics Similar to Sub-Saharan Africans by Unemployment Among Ages 25 to 29 years
In terms of unemployment among ages 25 to 29 years, the demographic groups most similar to Sub-Saharan Africans are Seminole (7.2%, a difference of 0.020%), Immigrants from Guatemala (7.2%, a difference of 0.17%), Immigrants from Uzbekistan (7.2%, a difference of 0.18%), Delaware (7.2%, a difference of 0.19%), and Portuguese (7.2%, a difference of 0.25%).
| Demographics | Rating | Rank | Unemployment Among Ages 25 to 29 years |
| Immigrants | Sierra Leone | 1.3 /100 | #241 | Tragic 7.1% |
| Spanish American Indians | 1.1 /100 | #242 | Tragic 7.1% |
| Yaqui | 1.0 /100 | #243 | Tragic 7.1% |
| Immigrants | Nonimmigrants | 0.9 /100 | #244 | Tragic 7.1% |
| Guatemalans | 0.9 /100 | #245 | Tragic 7.1% |
| Immigrants | Uzbekistan | 0.7 /100 | #246 | Tragic 7.2% |
| Immigrants | Guatemala | 0.7 /100 | #247 | Tragic 7.2% |
| Sub-Saharan Africans | 0.6 /100 | #248 | Tragic 7.2% |
| Seminole | 0.6 /100 | #249 | Tragic 7.2% |
| Delaware | 0.5 /100 | #250 | Tragic 7.2% |
| Portuguese | 0.5 /100 | #251 | Tragic 7.2% |
| Sierra Leoneans | 0.4 /100 | #252 | Tragic 7.2% |
| Immigrants | Portugal | 0.3 /100 | #253 | Tragic 7.2% |
| Ghanaians | 0.3 /100 | #254 | Tragic 7.2% |
| Immigrants | Cameroon | 0.3 /100 | #255 | Tragic 7.2% |
Demographics Similar to Immigrants from Norway by Unemployment Among Ages 25 to 29 years
In terms of unemployment among ages 25 to 29 years, the demographic groups most similar to Immigrants from Norway are Immigrants from Argentina (6.8%, a difference of 0.030%), Basque (6.8%, a difference of 0.11%), Scotch-Irish (6.8%, a difference of 0.12%), Immigrants from England (6.8%, a difference of 0.13%), and Ugandan (6.8%, a difference of 0.14%).
| Demographics | Rating | Rank | Unemployment Among Ages 25 to 29 years |
| Hungarians | 26.8 /100 | #196 | Fair 6.8% |
| Italians | 26.5 /100 | #197 | Fair 6.8% |
| Immigrants | Southern Europe | 24.6 /100 | #198 | Fair 6.8% |
| Guamanians/Chamorros | 24.3 /100 | #199 | Fair 6.8% |
| South American Indians | 23.3 /100 | #200 | Fair 6.8% |
| Basques | 22.5 /100 | #201 | Fair 6.8% |
| Immigrants | Argentina | 21.6 /100 | #202 | Fair 6.8% |
| Immigrants | Norway | 21.2 /100 | #203 | Fair 6.8% |
| Scotch-Irish | 20.0 /100 | #204 | Poor 6.8% |
| Immigrants | England | 19.8 /100 | #205 | Poor 6.8% |
| Ugandans | 19.8 /100 | #206 | Poor 6.8% |
| Immigrants | Denmark | 19.0 /100 | #207 | Poor 6.8% |
| Immigrants | Germany | 18.8 /100 | #208 | Poor 6.8% |
| Hawaiians | 17.1 /100 | #209 | Poor 6.8% |
| Canadians | 16.9 /100 | #210 | Poor 6.8% |