Subsaharan African vs Peruvian Ambulatory Disability
COMPARE
Subsaharan African
Peruvian
Ambulatory Disability
Ambulatory Disability Comparison
Sub-Saharan Africans
Peruvians
6.4%
AMBULATORY DISABILITY
2.3/ 100
METRIC RATING
233rd/ 347
METRIC RANK
5.7%
AMBULATORY DISABILITY
99.5/ 100
METRIC RATING
69th/ 347
METRIC RANK
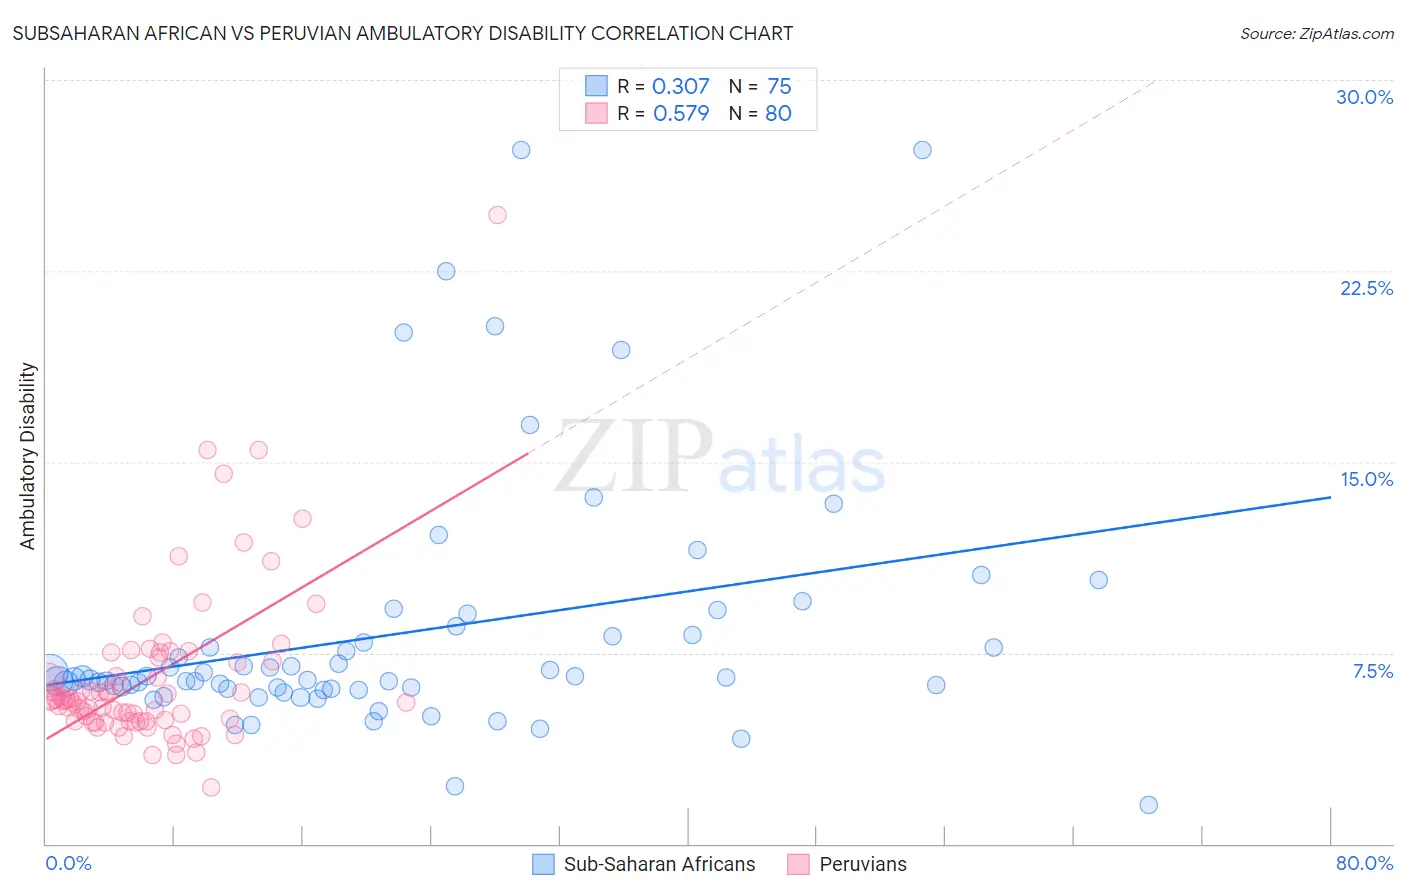
Subsaharan African vs Peruvian Ambulatory Disability Correlation Chart
The statistical analysis conducted on geographies consisting of 507,846,771 people shows a mild positive correlation between the proportion of Sub-Saharan Africans and percentage of population with ambulatory disability in the United States with a correlation coefficient (R) of 0.307 and weighted average of 6.4%. Similarly, the statistical analysis conducted on geographies consisting of 363,114,873 people shows a substantial positive correlation between the proportion of Peruvians and percentage of population with ambulatory disability in the United States with a correlation coefficient (R) of 0.579 and weighted average of 5.7%, a difference of 12.9%.
Ambulatory Disability Correlation Summary
| Measurement | Subsaharan African | Peruvian |
| Minimum | 1.5% | 2.2% |
| Maximum | 27.3% | 24.7% |
| Range | 25.7% | 22.5% |
| Mean | 8.3% | 6.6% |
| Median | 6.5% | 5.7% |
| Interquartile 25% (IQ1) | 6.1% | 4.8% |
| Interquartile 75% (IQ3) | 8.2% | 7.2% |
| Interquartile Range (IQR) | 2.1% | 2.4% |
| Standard Deviation (Sample) | 5.0% | 3.3% |
| Standard Deviation (Population) | 4.9% | 3.3% |
Similar Demographics by Ambulatory Disability
Demographics Similar to Sub-Saharan Africans by Ambulatory Disability
In terms of ambulatory disability, the demographic groups most similar to Sub-Saharan Africans are Immigrants from Liberia (6.4%, a difference of 0.030%), Assyrian/Chaldean/Syriac (6.4%, a difference of 0.060%), Hispanic or Latino (6.4%, a difference of 0.060%), Dutch (6.4%, a difference of 0.21%), and Immigrants from Germany (6.4%, a difference of 0.30%).
| Demographics | Rating | Rank | Ambulatory Disability |
| Slavs | 5.1 /100 | #226 | Tragic 6.4% |
| Cubans | 4.0 /100 | #227 | Tragic 6.4% |
| Portuguese | 4.0 /100 | #228 | Tragic 6.4% |
| Czechoslovakians | 3.8 /100 | #229 | Tragic 6.4% |
| Mexicans | 3.5 /100 | #230 | Tragic 6.4% |
| Panamanians | 3.1 /100 | #231 | Tragic 6.4% |
| Assyrians/Chaldeans/Syriacs | 2.4 /100 | #232 | Tragic 6.4% |
| Sub-Saharan Africans | 2.3 /100 | #233 | Tragic 6.4% |
| Immigrants | Liberia | 2.3 /100 | #234 | Tragic 6.4% |
| Hispanics or Latinos | 2.2 /100 | #235 | Tragic 6.4% |
| Dutch | 2.0 /100 | #236 | Tragic 6.4% |
| Immigrants | Germany | 1.8 /100 | #237 | Tragic 6.4% |
| Haitians | 1.8 /100 | #238 | Tragic 6.4% |
| Senegalese | 1.7 /100 | #239 | Tragic 6.4% |
| Immigrants | Senegal | 1.7 /100 | #240 | Tragic 6.4% |
Demographics Similar to Peruvians by Ambulatory Disability
In terms of ambulatory disability, the demographic groups most similar to Peruvians are Sierra Leonean (5.7%, a difference of 0.23%), Immigrants from Peru (5.7%, a difference of 0.32%), Brazilian (5.7%, a difference of 0.34%), Immigrants from Northern Africa (5.7%, a difference of 0.36%), and Immigrants from Cameroon (5.7%, a difference of 0.36%).
| Demographics | Rating | Rank | Ambulatory Disability |
| Immigrants | Spain | 99.7 /100 | #62 | Exceptional 5.6% |
| Immigrants | France | 99.7 /100 | #63 | Exceptional 5.6% |
| Laotians | 99.7 /100 | #64 | Exceptional 5.7% |
| Immigrants | Switzerland | 99.7 /100 | #65 | Exceptional 5.7% |
| Israelis | 99.6 /100 | #66 | Exceptional 5.7% |
| Immigrants | Uganda | 99.6 /100 | #67 | Exceptional 5.7% |
| Sri Lankans | 99.6 /100 | #68 | Exceptional 5.7% |
| Peruvians | 99.5 /100 | #69 | Exceptional 5.7% |
| Sierra Leoneans | 99.4 /100 | #70 | Exceptional 5.7% |
| Immigrants | Peru | 99.4 /100 | #71 | Exceptional 5.7% |
| Brazilians | 99.4 /100 | #72 | Exceptional 5.7% |
| Immigrants | Northern Africa | 99.4 /100 | #73 | Exceptional 5.7% |
| Immigrants | Cameroon | 99.4 /100 | #74 | Exceptional 5.7% |
| Immigrants | South Africa | 99.3 /100 | #75 | Exceptional 5.7% |
| Sudanese | 99.3 /100 | #76 | Exceptional 5.7% |