Spanish vs Czech Disability Age 5 to 17
COMPARE
Spanish
Czech
Disability Age 5 to 17
Disability Age 5 to 17 Comparison
Spanish
Czechs
6.0%
DISABILITY AGE 5 TO 17
0.5/ 100
METRIC RATING
267th/ 347
METRIC RANK
5.8%
DISABILITY AGE 5 TO 17
7.4/ 100
METRIC RATING
217th/ 347
METRIC RANK
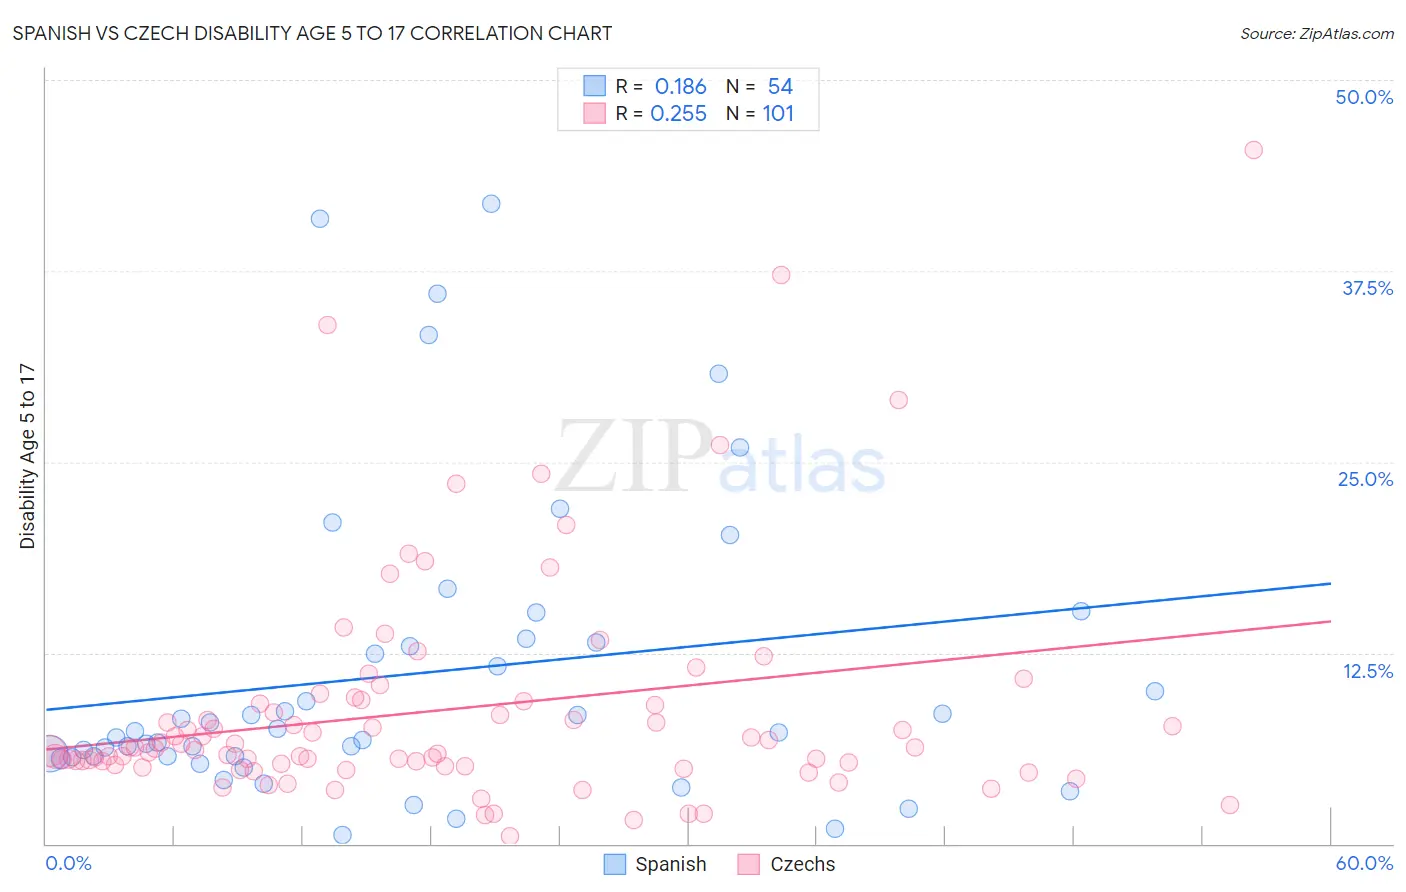
Spanish vs Czech Disability Age 5 to 17 Correlation Chart
The statistical analysis conducted on geographies consisting of 418,244,761 people shows a poor positive correlation between the proportion of Spanish and percentage of population with a disability between the ages 5 and 17 in the United States with a correlation coefficient (R) of 0.186 and weighted average of 6.0%. Similarly, the statistical analysis conducted on geographies consisting of 477,643,997 people shows a weak positive correlation between the proportion of Czechs and percentage of population with a disability between the ages 5 and 17 in the United States with a correlation coefficient (R) of 0.255 and weighted average of 5.8%, a difference of 3.3%.
Disability Age 5 to 17 Correlation Summary
| Measurement | Spanish | Czech |
| Minimum | 0.61% | 0.52% |
| Maximum | 41.9% | 45.5% |
| Range | 41.3% | 44.9% |
| Mean | 11.1% | 8.8% |
| Median | 7.3% | 6.2% |
| Interquartile 25% (IQ1) | 5.7% | 5.1% |
| Interquartile 75% (IQ3) | 13.2% | 9.3% |
| Interquartile Range (IQR) | 7.5% | 4.1% |
| Standard Deviation (Sample) | 9.8% | 7.5% |
| Standard Deviation (Population) | 9.8% | 7.5% |
Similar Demographics by Disability Age 5 to 17
Demographics Similar to Spanish by Disability Age 5 to 17
In terms of disability age 5 to 17, the demographic groups most similar to Spanish are Slovene (6.0%, a difference of 0.11%), Panamanian (6.0%, a difference of 0.13%), Sioux (6.0%, a difference of 0.19%), Canadian (6.0%, a difference of 0.21%), and Liberian (6.0%, a difference of 0.22%).
| Demographics | Rating | Rank | Disability Age 5 to 17 |
| Somalis | 0.8 /100 | #260 | Tragic 5.9% |
| Immigrants | Middle Africa | 0.7 /100 | #261 | Tragic 5.9% |
| Immigrants | Western Africa | 0.7 /100 | #262 | Tragic 5.9% |
| Czechoslovakians | 0.7 /100 | #263 | Tragic 5.9% |
| Canadians | 0.6 /100 | #264 | Tragic 6.0% |
| Panamanians | 0.6 /100 | #265 | Tragic 6.0% |
| Slovenes | 0.6 /100 | #266 | Tragic 6.0% |
| Spanish | 0.5 /100 | #267 | Tragic 6.0% |
| Sioux | 0.4 /100 | #268 | Tragic 6.0% |
| Liberians | 0.4 /100 | #269 | Tragic 6.0% |
| Immigrants | Somalia | 0.4 /100 | #270 | Tragic 6.0% |
| Immigrants | Zaire | 0.2 /100 | #271 | Tragic 6.0% |
| Finns | 0.2 /100 | #272 | Tragic 6.0% |
| Alaska Natives | 0.2 /100 | #273 | Tragic 6.0% |
| Cheyenne | 0.2 /100 | #274 | Tragic 6.0% |
Demographics Similar to Czechs by Disability Age 5 to 17
In terms of disability age 5 to 17, the demographic groups most similar to Czechs are Nigerian (5.8%, a difference of 0.030%), Immigrants from Sierra Leone (5.8%, a difference of 0.050%), Sierra Leonean (5.8%, a difference of 0.060%), Belgian (5.8%, a difference of 0.080%), and Swedish (5.8%, a difference of 0.12%).
| Demographics | Rating | Rank | Disability Age 5 to 17 |
| Immigrants | Haiti | 9.5 /100 | #210 | Tragic 5.8% |
| Yugoslavians | 9.1 /100 | #211 | Tragic 5.8% |
| Immigrants | Panama | 8.7 /100 | #212 | Tragic 5.8% |
| Immigrants | Cameroon | 8.3 /100 | #213 | Tragic 5.8% |
| Immigrants | Morocco | 8.3 /100 | #214 | Tragic 5.8% |
| Swedes | 8.1 /100 | #215 | Tragic 5.8% |
| Nigerians | 7.5 /100 | #216 | Tragic 5.8% |
| Czechs | 7.4 /100 | #217 | Tragic 5.8% |
| Immigrants | Sierra Leone | 7.1 /100 | #218 | Tragic 5.8% |
| Sierra Leoneans | 7.0 /100 | #219 | Tragic 5.8% |
| Belgians | 6.9 /100 | #220 | Tragic 5.8% |
| Lithuanians | 6.7 /100 | #221 | Tragic 5.8% |
| Immigrants | Sudan | 6.7 /100 | #222 | Tragic 5.8% |
| Alsatians | 6.0 /100 | #223 | Tragic 5.8% |
| Mexicans | 5.7 /100 | #224 | Tragic 5.8% |