Brazilian vs Immigrants from Nicaragua Disability
COMPARE
Brazilian
Immigrants from Nicaragua
Disability
Disability Comparison
Brazilians
Immigrants from Nicaragua
11.4%
DISABILITY
93.3/ 100
METRIC RATING
122nd/ 347
METRIC RANK
11.3%
DISABILITY
96.8/ 100
METRIC RATING
101st/ 347
METRIC RANK
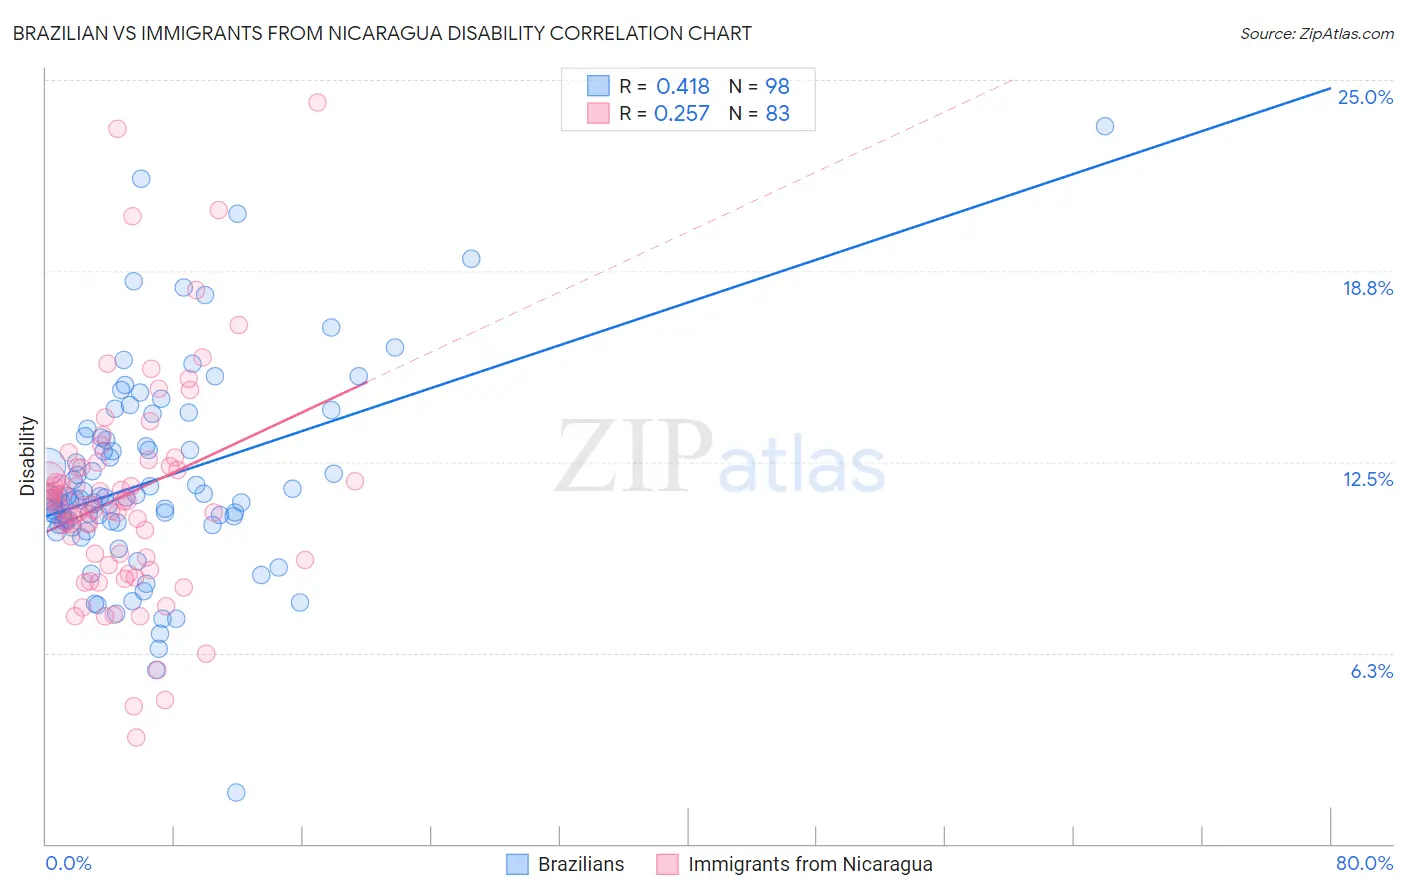
Brazilian vs Immigrants from Nicaragua Disability Correlation Chart
The statistical analysis conducted on geographies consisting of 323,954,129 people shows a moderate positive correlation between the proportion of Brazilians and percentage of population with a disability in the United States with a correlation coefficient (R) of 0.418 and weighted average of 11.4%. Similarly, the statistical analysis conducted on geographies consisting of 236,329,178 people shows a weak positive correlation between the proportion of Immigrants from Nicaragua and percentage of population with a disability in the United States with a correlation coefficient (R) of 0.257 and weighted average of 11.3%, a difference of 0.90%.
Disability Correlation Summary
| Measurement | Brazilian | Immigrants from Nicaragua |
| Minimum | 1.7% | 3.5% |
| Maximum | 23.5% | 24.3% |
| Range | 21.8% | 20.8% |
| Mean | 11.9% | 11.4% |
| Median | 11.3% | 11.1% |
| Interquartile 25% (IQ1) | 10.5% | 9.3% |
| Interquartile 75% (IQ3) | 13.3% | 12.3% |
| Interquartile Range (IQR) | 2.8% | 3.0% |
| Standard Deviation (Sample) | 3.3% | 3.6% |
| Standard Deviation (Population) | 3.3% | 3.6% |
Similar Demographics by Disability
Demographics Similar to Brazilians by Disability
In terms of disability, the demographic groups most similar to Brazilians are Immigrants from Costa Rica (11.4%, a difference of 0.020%), Immigrants from North Macedonia (11.4%, a difference of 0.030%), Central American (11.4%, a difference of 0.040%), Korean (11.3%, a difference of 0.090%), and Luxembourger (11.3%, a difference of 0.10%).
| Demographics | Rating | Rank | Disability |
| Immigrants | Philippines | 94.6 /100 | #115 | Exceptional 11.3% |
| Immigrants | Northern Europe | 94.1 /100 | #116 | Exceptional 11.3% |
| Luxembourgers | 93.9 /100 | #117 | Exceptional 11.3% |
| Koreans | 93.8 /100 | #118 | Exceptional 11.3% |
| Central Americans | 93.5 /100 | #119 | Exceptional 11.4% |
| Immigrants | North Macedonia | 93.5 /100 | #120 | Exceptional 11.4% |
| Immigrants | Costa Rica | 93.4 /100 | #121 | Exceptional 11.4% |
| Brazilians | 93.3 /100 | #122 | Exceptional 11.4% |
| South Africans | 92.3 /100 | #123 | Exceptional 11.4% |
| South American Indians | 92.2 /100 | #124 | Exceptional 11.4% |
| Costa Ricans | 91.9 /100 | #125 | Exceptional 11.4% |
| Immigrants | Latvia | 90.9 /100 | #126 | Exceptional 11.4% |
| Immigrants | Italy | 90.4 /100 | #127 | Exceptional 11.4% |
| Immigrants | Europe | 90.4 /100 | #128 | Exceptional 11.4% |
| Macedonians | 90.3 /100 | #129 | Exceptional 11.4% |
Demographics Similar to Immigrants from Nicaragua by Disability
In terms of disability, the demographic groups most similar to Immigrants from Nicaragua are Immigrants from Greece (11.3%, a difference of 0.040%), Immigrants from Eastern Africa (11.3%, a difference of 0.060%), Immigrants from Uruguay (11.3%, a difference of 0.14%), Immigrants (11.3%, a difference of 0.14%), and Immigrants from Kazakhstan (11.3%, a difference of 0.15%).
| Demographics | Rating | Rank | Disability |
| Immigrants | Morocco | 97.8 /100 | #94 | Exceptional 11.2% |
| Eastern Europeans | 97.8 /100 | #95 | Exceptional 11.2% |
| Immigrants | Zimbabwe | 97.7 /100 | #96 | Exceptional 11.2% |
| Bhutanese | 97.4 /100 | #97 | Exceptional 11.2% |
| Uruguayans | 97.4 /100 | #98 | Exceptional 11.2% |
| Immigrants | Czechoslovakia | 97.4 /100 | #99 | Exceptional 11.2% |
| Immigrants | Greece | 96.9 /100 | #100 | Exceptional 11.3% |
| Immigrants | Nicaragua | 96.8 /100 | #101 | Exceptional 11.3% |
| Immigrants | Eastern Africa | 96.7 /100 | #102 | Exceptional 11.3% |
| Immigrants | Uruguay | 96.4 /100 | #103 | Exceptional 11.3% |
| Immigrants | Immigrants | 96.4 /100 | #104 | Exceptional 11.3% |
| Immigrants | Kazakhstan | 96.4 /100 | #105 | Exceptional 11.3% |
| Immigrants | Eastern Europe | 96.3 /100 | #106 | Exceptional 11.3% |
| Nicaraguans | 96.2 /100 | #107 | Exceptional 11.3% |
| Immigrants | Nigeria | 96.0 /100 | #108 | Exceptional 11.3% |