Spanish vs Arapaho Unemployment Among Ages 55 to 59 years
COMPARE
Spanish
Arapaho
Unemployment Among Ages 55 to 59 years
Unemployment Among Ages 55 to 59 years Comparison
Spanish
Arapaho
5.0%
UNEMPLOYMENT AMONG AGES 55 TO 59 YEARS
5.1/ 100
METRIC RATING
222nd/ 347
METRIC RANK
6.1%
UNEMPLOYMENT AMONG AGES 55 TO 59 YEARS
0.0/ 100
METRIC RATING
327th/ 347
METRIC RANK
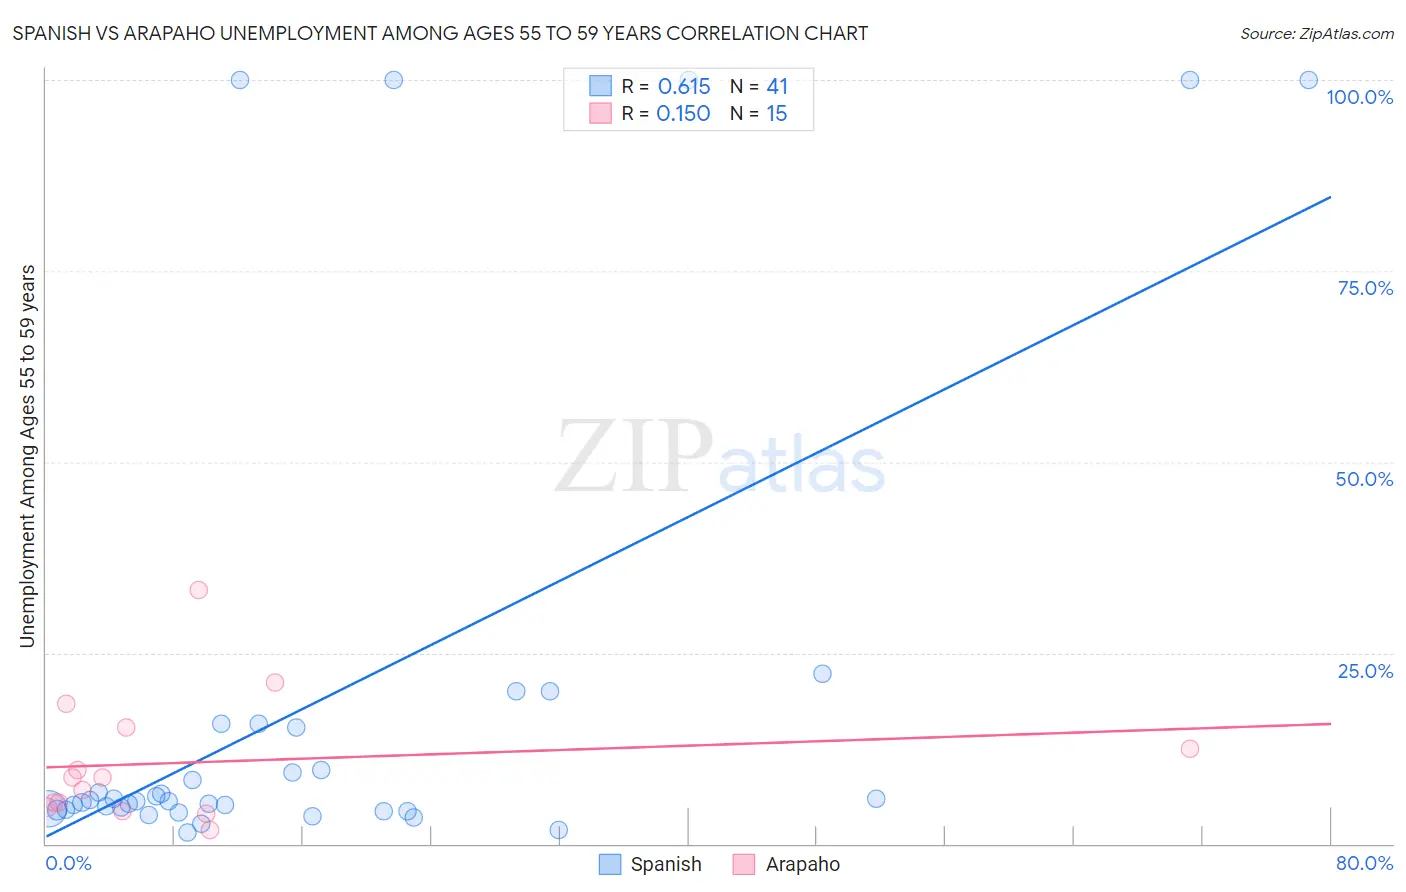
Spanish vs Arapaho Unemployment Among Ages 55 to 59 years Correlation Chart
The statistical analysis conducted on geographies consisting of 388,932,009 people shows a significant positive correlation between the proportion of Spanish and unemployment rate among population between the ages 55 and 59 in the United States with a correlation coefficient (R) of 0.615 and weighted average of 5.0%. Similarly, the statistical analysis conducted on geographies consisting of 28,926,135 people shows a poor positive correlation between the proportion of Arapaho and unemployment rate among population between the ages 55 and 59 in the United States with a correlation coefficient (R) of 0.150 and weighted average of 6.1%, a difference of 22.1%.
Unemployment Among Ages 55 to 59 years Correlation Summary
| Measurement | Spanish | Arapaho |
| Minimum | 1.5% | 1.8% |
| Maximum | 100.0% | 33.3% |
| Range | 98.5% | 31.5% |
| Mean | 18.6% | 10.7% |
| Median | 5.5% | 8.6% |
| Interquartile 25% (IQ1) | 4.4% | 4.8% |
| Interquartile 75% (IQ3) | 15.4% | 15.2% |
| Interquartile Range (IQR) | 11.0% | 10.5% |
| Standard Deviation (Sample) | 31.1% | 8.4% |
| Standard Deviation (Population) | 30.7% | 8.1% |
Similar Demographics by Unemployment Among Ages 55 to 59 years
Demographics Similar to Spanish by Unemployment Among Ages 55 to 59 years
In terms of unemployment among ages 55 to 59 years, the demographic groups most similar to Spanish are Immigrants from Ireland (5.0%, a difference of 0.070%), Subsaharan African (5.0%, a difference of 0.14%), Costa Rican (5.0%, a difference of 0.15%), Immigrants from China (5.0%, a difference of 0.20%), and Immigrants from Iran (5.0%, a difference of 0.33%).
| Demographics | Rating | Rank | Unemployment Among Ages 55 to 59 years |
| Syrians | 8.6 /100 | #215 | Tragic 4.9% |
| Spanish Americans | 8.1 /100 | #216 | Tragic 4.9% |
| Immigrants | Brazil | 8.1 /100 | #217 | Tragic 4.9% |
| Immigrants | Austria | 8.0 /100 | #218 | Tragic 4.9% |
| Immigrants | Nigeria | 8.0 /100 | #219 | Tragic 4.9% |
| Indians (Asian) | 7.6 /100 | #220 | Tragic 4.9% |
| Nigerians | 7.5 /100 | #221 | Tragic 4.9% |
| Spanish | 5.1 /100 | #222 | Tragic 5.0% |
| Immigrants | Ireland | 4.8 /100 | #223 | Tragic 5.0% |
| Sub-Saharan Africans | 4.4 /100 | #224 | Tragic 5.0% |
| Costa Ricans | 4.4 /100 | #225 | Tragic 5.0% |
| Immigrants | China | 4.2 /100 | #226 | Tragic 5.0% |
| Immigrants | Iran | 3.7 /100 | #227 | Tragic 5.0% |
| Immigrants | Liberia | 3.2 /100 | #228 | Tragic 5.0% |
| Immigrants | Western Asia | 3.0 /100 | #229 | Tragic 5.0% |
Demographics Similar to Arapaho by Unemployment Among Ages 55 to 59 years
In terms of unemployment among ages 55 to 59 years, the demographic groups most similar to Arapaho are Native/Alaskan (6.0%, a difference of 0.88%), Yuman (6.1%, a difference of 1.2%), Immigrants from Armenia (6.0%, a difference of 1.3%), Dominican (6.2%, a difference of 2.6%), and Vietnamese (5.9%, a difference of 3.0%).
| Demographics | Rating | Rank | Unemployment Among Ages 55 to 59 years |
| Immigrants | Azores | 0.0 /100 | #320 | Tragic 5.8% |
| Chippewa | 0.0 /100 | #321 | Tragic 5.9% |
| Crow | 0.0 /100 | #322 | Tragic 5.9% |
| Immigrants | Bangladesh | 0.0 /100 | #323 | Tragic 5.9% |
| Vietnamese | 0.0 /100 | #324 | Tragic 5.9% |
| Immigrants | Armenia | 0.0 /100 | #325 | Tragic 6.0% |
| Natives/Alaskans | 0.0 /100 | #326 | Tragic 6.0% |
| Arapaho | 0.0 /100 | #327 | Tragic 6.1% |
| Yuman | 0.0 /100 | #328 | Tragic 6.1% |
| Dominicans | 0.0 /100 | #329 | Tragic 6.2% |
| Alaska Natives | 0.0 /100 | #330 | Tragic 6.2% |
| Immigrants | Dominican Republic | 0.0 /100 | #331 | Tragic 6.3% |
| Aleuts | 0.0 /100 | #332 | Tragic 6.4% |
| Pima | 0.0 /100 | #333 | Tragic 6.6% |
| Pueblo | 0.0 /100 | #334 | Tragic 6.7% |