Spanish American vs Immigrants from Middle Africa Cognitive Disability
COMPARE
Spanish American
Immigrants from Middle Africa
Cognitive Disability
Cognitive Disability Comparison
Spanish Americans
Immigrants from Middle Africa
18.0%
COGNITIVE DISABILITY
0.4/ 100
METRIC RATING
265th/ 347
METRIC RANK
18.6%
COGNITIVE DISABILITY
0.0/ 100
METRIC RATING
316th/ 347
METRIC RANK
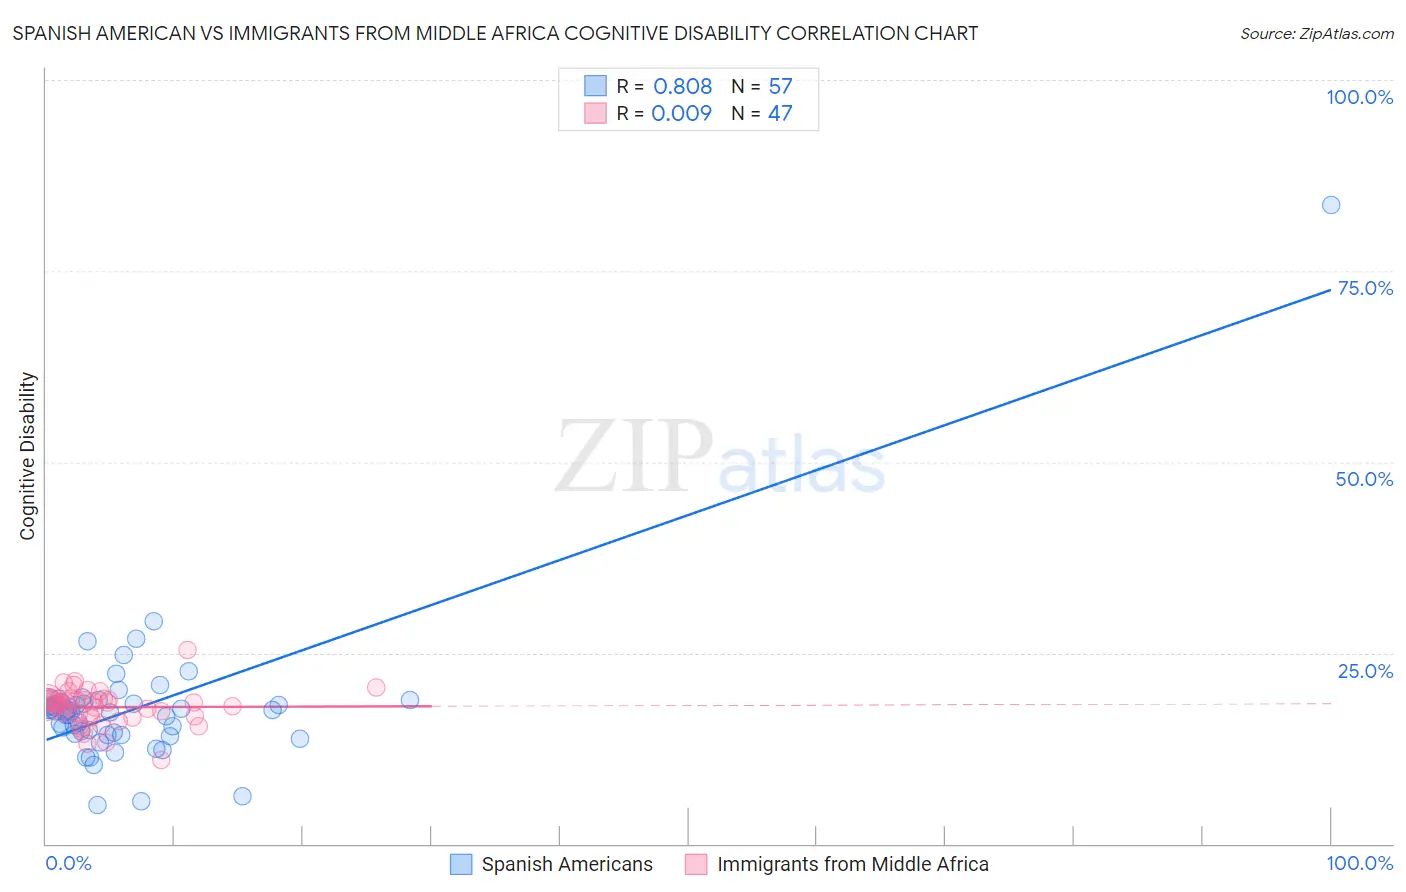
Spanish American vs Immigrants from Middle Africa Cognitive Disability Correlation Chart
The statistical analysis conducted on geographies consisting of 103,167,969 people shows a very strong positive correlation between the proportion of Spanish Americans and percentage of population with cognitive disability in the United States with a correlation coefficient (R) of 0.808 and weighted average of 18.0%. Similarly, the statistical analysis conducted on geographies consisting of 202,719,317 people shows no correlation between the proportion of Immigrants from Middle Africa and percentage of population with cognitive disability in the United States with a correlation coefficient (R) of 0.009 and weighted average of 18.6%, a difference of 3.4%.
Cognitive Disability Correlation Summary
| Measurement | Spanish American | Immigrants from Middle Africa |
| Minimum | 5.1% | 10.9% |
| Maximum | 83.6% | 25.3% |
| Range | 78.6% | 14.4% |
| Mean | 17.8% | 17.9% |
| Median | 17.4% | 18.4% |
| Interquartile 25% (IQ1) | 14.4% | 16.7% |
| Interquartile 75% (IQ3) | 18.4% | 18.9% |
| Interquartile Range (IQR) | 4.1% | 2.2% |
| Standard Deviation (Sample) | 10.0% | 2.4% |
| Standard Deviation (Population) | 9.9% | 2.4% |
Similar Demographics by Cognitive Disability
Demographics Similar to Spanish Americans by Cognitive Disability
In terms of cognitive disability, the demographic groups most similar to Spanish Americans are Belizean (18.0%, a difference of 0.0%), Menominee (18.0%, a difference of 0.030%), Nepalese (18.0%, a difference of 0.060%), Cherokee (18.0%, a difference of 0.070%), and Immigrants from Barbados (17.9%, a difference of 0.090%).
| Demographics | Rating | Rank | Cognitive Disability |
| Immigrants | Armenia | 0.6 /100 | #258 | Tragic 17.9% |
| Ethiopians | 0.5 /100 | #259 | Tragic 17.9% |
| Immigrants | Belize | 0.5 /100 | #260 | Tragic 17.9% |
| Guamanians/Chamorros | 0.5 /100 | #261 | Tragic 17.9% |
| Sierra Leoneans | 0.4 /100 | #262 | Tragic 17.9% |
| Immigrants | Barbados | 0.4 /100 | #263 | Tragic 17.9% |
| Menominee | 0.4 /100 | #264 | Tragic 18.0% |
| Spanish Americans | 0.4 /100 | #265 | Tragic 18.0% |
| Belizeans | 0.4 /100 | #266 | Tragic 18.0% |
| Nepalese | 0.3 /100 | #267 | Tragic 18.0% |
| Cherokee | 0.3 /100 | #268 | Tragic 18.0% |
| Hondurans | 0.3 /100 | #269 | Tragic 18.0% |
| Immigrants | Bahamas | 0.3 /100 | #270 | Tragic 18.0% |
| Potawatomi | 0.2 /100 | #271 | Tragic 18.0% |
| Immigrants | Honduras | 0.2 /100 | #272 | Tragic 18.0% |
Demographics Similar to Immigrants from Middle Africa by Cognitive Disability
In terms of cognitive disability, the demographic groups most similar to Immigrants from Middle Africa are Immigrants from Dominica (18.6%, a difference of 0.080%), Liberian (18.6%, a difference of 0.080%), Bangladeshi (18.6%, a difference of 0.20%), Comanche (18.6%, a difference of 0.24%), and Subsaharan African (18.5%, a difference of 0.26%).
| Demographics | Rating | Rank | Cognitive Disability |
| Immigrants | Eastern Africa | 0.0 /100 | #309 | Tragic 18.4% |
| Choctaw | 0.0 /100 | #310 | Tragic 18.4% |
| Hmong | 0.0 /100 | #311 | Tragic 18.4% |
| Chickasaw | 0.0 /100 | #312 | Tragic 18.5% |
| Yaqui | 0.0 /100 | #313 | Tragic 18.5% |
| Sub-Saharan Africans | 0.0 /100 | #314 | Tragic 18.5% |
| Immigrants | Dominica | 0.0 /100 | #315 | Tragic 18.6% |
| Immigrants | Middle Africa | 0.0 /100 | #316 | Tragic 18.6% |
| Liberians | 0.0 /100 | #317 | Tragic 18.6% |
| Bangladeshis | 0.0 /100 | #318 | Tragic 18.6% |
| Comanche | 0.0 /100 | #319 | Tragic 18.6% |
| Apache | 0.0 /100 | #320 | Tragic 18.6% |
| Africans | 0.0 /100 | #321 | Tragic 18.6% |
| Immigrants | Liberia | 0.0 /100 | #322 | Tragic 18.7% |
| Pueblo | 0.0 /100 | #323 | Tragic 18.7% |