Spanish American vs Immigrants from Sierra Leone Cognitive Disability
COMPARE
Spanish American
Immigrants from Sierra Leone
Cognitive Disability
Cognitive Disability Comparison
Spanish Americans
Immigrants from Sierra Leone
18.0%
COGNITIVE DISABILITY
0.4/ 100
METRIC RATING
265th/ 347
METRIC RANK
17.6%
COGNITIVE DISABILITY
6.3/ 100
METRIC RATING
219th/ 347
METRIC RANK
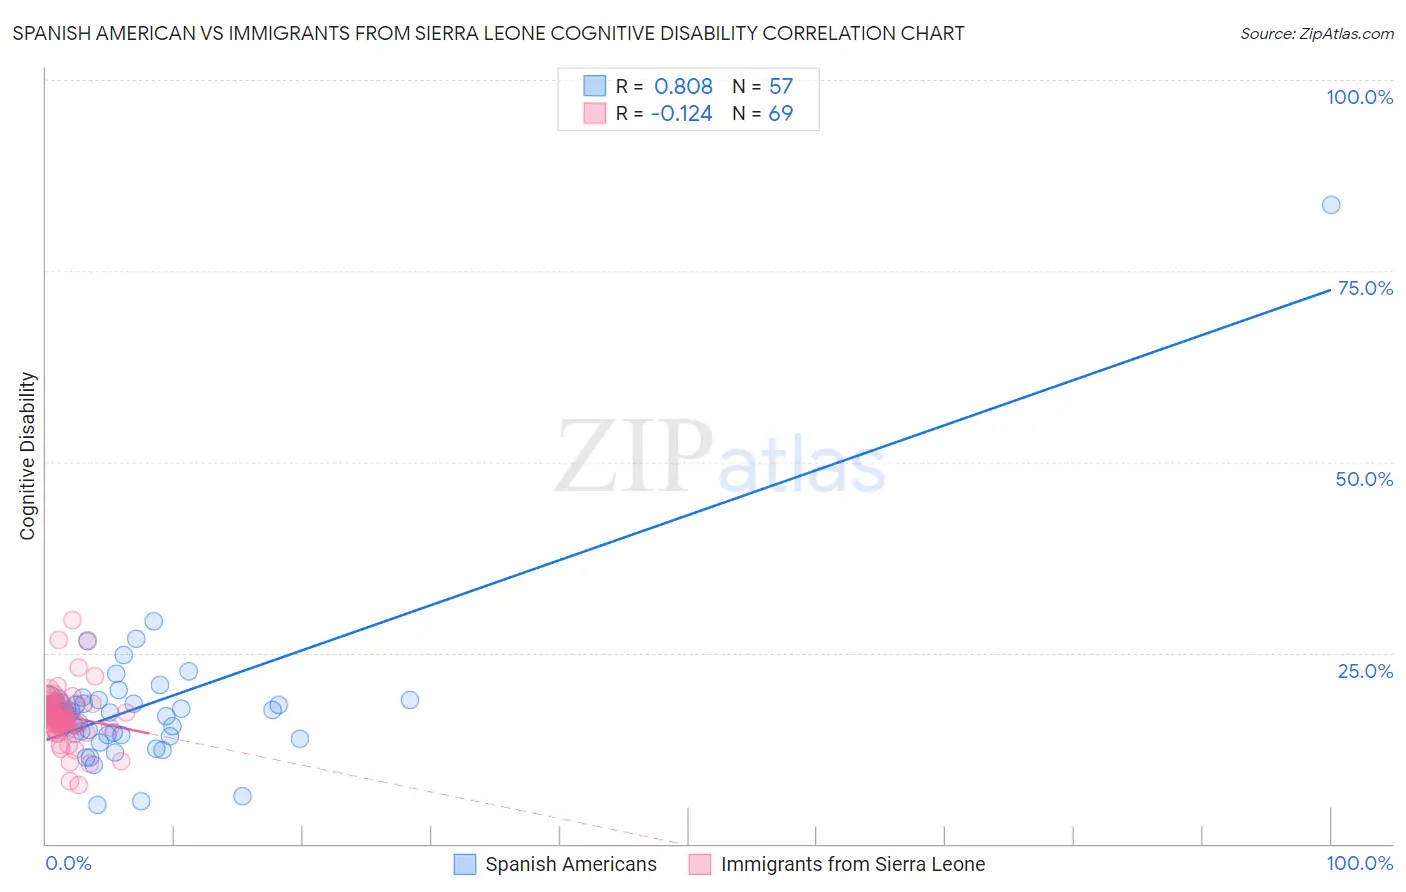
Spanish American vs Immigrants from Sierra Leone Cognitive Disability Correlation Chart
The statistical analysis conducted on geographies consisting of 103,167,969 people shows a very strong positive correlation between the proportion of Spanish Americans and percentage of population with cognitive disability in the United States with a correlation coefficient (R) of 0.808 and weighted average of 18.0%. Similarly, the statistical analysis conducted on geographies consisting of 101,650,758 people shows a poor negative correlation between the proportion of Immigrants from Sierra Leone and percentage of population with cognitive disability in the United States with a correlation coefficient (R) of -0.124 and weighted average of 17.6%, a difference of 2.0%.
Cognitive Disability Correlation Summary
| Measurement | Spanish American | Immigrants from Sierra Leone |
| Minimum | 5.1% | 7.7% |
| Maximum | 83.6% | 29.3% |
| Range | 78.6% | 21.6% |
| Mean | 17.8% | 16.7% |
| Median | 17.4% | 16.4% |
| Interquartile 25% (IQ1) | 14.4% | 15.2% |
| Interquartile 75% (IQ3) | 18.4% | 18.3% |
| Interquartile Range (IQR) | 4.1% | 3.1% |
| Standard Deviation (Sample) | 10.0% | 3.6% |
| Standard Deviation (Population) | 9.9% | 3.6% |
Similar Demographics by Cognitive Disability
Demographics Similar to Spanish Americans by Cognitive Disability
In terms of cognitive disability, the demographic groups most similar to Spanish Americans are Belizean (18.0%, a difference of 0.0%), Menominee (18.0%, a difference of 0.030%), Nepalese (18.0%, a difference of 0.060%), Cherokee (18.0%, a difference of 0.070%), and Immigrants from Barbados (17.9%, a difference of 0.090%).
| Demographics | Rating | Rank | Cognitive Disability |
| Immigrants | Armenia | 0.6 /100 | #258 | Tragic 17.9% |
| Ethiopians | 0.5 /100 | #259 | Tragic 17.9% |
| Immigrants | Belize | 0.5 /100 | #260 | Tragic 17.9% |
| Guamanians/Chamorros | 0.5 /100 | #261 | Tragic 17.9% |
| Sierra Leoneans | 0.4 /100 | #262 | Tragic 17.9% |
| Immigrants | Barbados | 0.4 /100 | #263 | Tragic 17.9% |
| Menominee | 0.4 /100 | #264 | Tragic 18.0% |
| Spanish Americans | 0.4 /100 | #265 | Tragic 18.0% |
| Belizeans | 0.4 /100 | #266 | Tragic 18.0% |
| Nepalese | 0.3 /100 | #267 | Tragic 18.0% |
| Cherokee | 0.3 /100 | #268 | Tragic 18.0% |
| Hondurans | 0.3 /100 | #269 | Tragic 18.0% |
| Immigrants | Bahamas | 0.3 /100 | #270 | Tragic 18.0% |
| Potawatomi | 0.2 /100 | #271 | Tragic 18.0% |
| Immigrants | Honduras | 0.2 /100 | #272 | Tragic 18.0% |
Demographics Similar to Immigrants from Sierra Leone by Cognitive Disability
In terms of cognitive disability, the demographic groups most similar to Immigrants from Sierra Leone are Icelander (17.6%, a difference of 0.010%), Zimbabwean (17.6%, a difference of 0.030%), Salvadoran (17.6%, a difference of 0.040%), Moroccan (17.6%, a difference of 0.050%), and Okinawan (17.6%, a difference of 0.060%).
| Demographics | Rating | Rank | Cognitive Disability |
| Immigrants | Oceania | 7.3 /100 | #212 | Tragic 17.6% |
| Hawaiians | 7.2 /100 | #213 | Tragic 17.6% |
| Immigrants | El Salvador | 7.0 /100 | #214 | Tragic 17.6% |
| Alaskan Athabascans | 6.9 /100 | #215 | Tragic 17.6% |
| Okinawans | 6.8 /100 | #216 | Tragic 17.6% |
| Salvadorans | 6.7 /100 | #217 | Tragic 17.6% |
| Icelanders | 6.4 /100 | #218 | Tragic 17.6% |
| Immigrants | Sierra Leone | 6.3 /100 | #219 | Tragic 17.6% |
| Zimbabweans | 6.1 /100 | #220 | Tragic 17.6% |
| Moroccans | 5.9 /100 | #221 | Tragic 17.6% |
| Central Americans | 4.5 /100 | #222 | Tragic 17.7% |
| Alsatians | 4.5 /100 | #223 | Tragic 17.7% |
| Fijians | 3.4 /100 | #224 | Tragic 17.7% |
| Vietnamese | 3.4 /100 | #225 | Tragic 17.7% |
| Marshallese | 2.7 /100 | #226 | Tragic 17.7% |