Spanish American vs Immigrants from Moldova Cognitive Disability
COMPARE
Spanish American
Immigrants from Moldova
Cognitive Disability
Cognitive Disability Comparison
Spanish Americans
Immigrants from Moldova
18.0%
COGNITIVE DISABILITY
0.4/ 100
METRIC RATING
265th/ 347
METRIC RANK
16.7%
COGNITIVE DISABILITY
99.1/ 100
METRIC RATING
85th/ 347
METRIC RANK
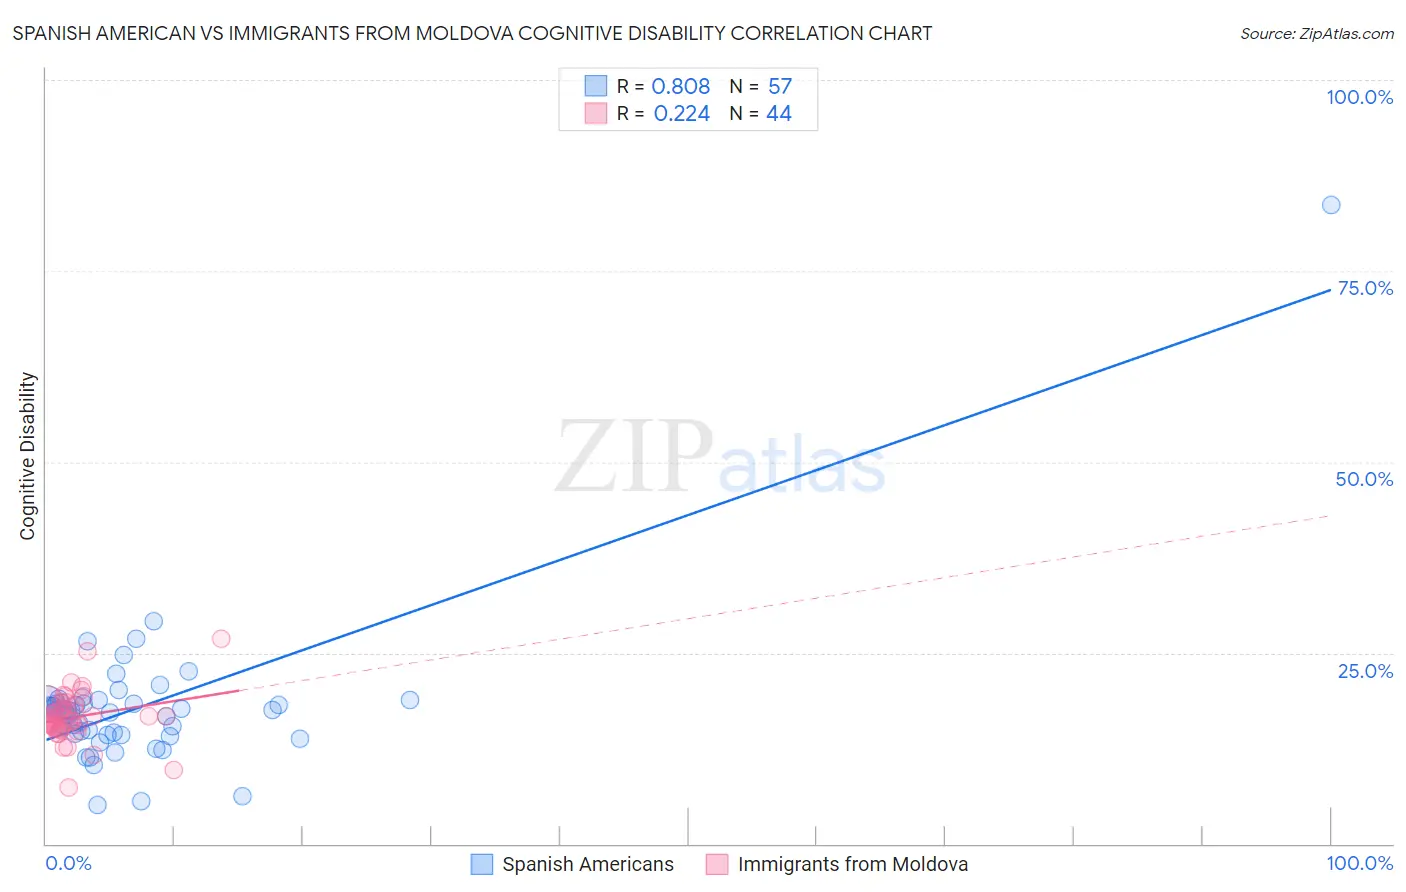
Spanish American vs Immigrants from Moldova Cognitive Disability Correlation Chart
The statistical analysis conducted on geographies consisting of 103,167,969 people shows a very strong positive correlation between the proportion of Spanish Americans and percentage of population with cognitive disability in the United States with a correlation coefficient (R) of 0.808 and weighted average of 18.0%. Similarly, the statistical analysis conducted on geographies consisting of 124,376,689 people shows a weak positive correlation between the proportion of Immigrants from Moldova and percentage of population with cognitive disability in the United States with a correlation coefficient (R) of 0.224 and weighted average of 16.7%, a difference of 7.6%.
Cognitive Disability Correlation Summary
| Measurement | Spanish American | Immigrants from Moldova |
| Minimum | 5.1% | 7.4% |
| Maximum | 83.6% | 26.8% |
| Range | 78.6% | 19.4% |
| Mean | 17.8% | 16.6% |
| Median | 17.4% | 16.4% |
| Interquartile 25% (IQ1) | 14.4% | 15.2% |
| Interquartile 75% (IQ3) | 18.4% | 18.2% |
| Interquartile Range (IQR) | 4.1% | 3.0% |
| Standard Deviation (Sample) | 10.0% | 3.4% |
| Standard Deviation (Population) | 9.9% | 3.3% |
Similar Demographics by Cognitive Disability
Demographics Similar to Spanish Americans by Cognitive Disability
In terms of cognitive disability, the demographic groups most similar to Spanish Americans are Belizean (18.0%, a difference of 0.0%), Menominee (18.0%, a difference of 0.030%), Nepalese (18.0%, a difference of 0.060%), Cherokee (18.0%, a difference of 0.070%), and Immigrants from Barbados (17.9%, a difference of 0.090%).
| Demographics | Rating | Rank | Cognitive Disability |
| Immigrants | Armenia | 0.6 /100 | #258 | Tragic 17.9% |
| Ethiopians | 0.5 /100 | #259 | Tragic 17.9% |
| Immigrants | Belize | 0.5 /100 | #260 | Tragic 17.9% |
| Guamanians/Chamorros | 0.5 /100 | #261 | Tragic 17.9% |
| Sierra Leoneans | 0.4 /100 | #262 | Tragic 17.9% |
| Immigrants | Barbados | 0.4 /100 | #263 | Tragic 17.9% |
| Menominee | 0.4 /100 | #264 | Tragic 18.0% |
| Spanish Americans | 0.4 /100 | #265 | Tragic 18.0% |
| Belizeans | 0.4 /100 | #266 | Tragic 18.0% |
| Nepalese | 0.3 /100 | #267 | Tragic 18.0% |
| Cherokee | 0.3 /100 | #268 | Tragic 18.0% |
| Hondurans | 0.3 /100 | #269 | Tragic 18.0% |
| Immigrants | Bahamas | 0.3 /100 | #270 | Tragic 18.0% |
| Potawatomi | 0.2 /100 | #271 | Tragic 18.0% |
| Immigrants | Honduras | 0.2 /100 | #272 | Tragic 18.0% |
Demographics Similar to Immigrants from Moldova by Cognitive Disability
In terms of cognitive disability, the demographic groups most similar to Immigrants from Moldova are Belgian (16.7%, a difference of 0.020%), Serbian (16.7%, a difference of 0.030%), Immigrants from South Africa (16.7%, a difference of 0.030%), Native Hawaiian (16.7%, a difference of 0.050%), and Swiss (16.7%, a difference of 0.10%).
| Demographics | Rating | Rank | Cognitive Disability |
| Peruvians | 99.3 /100 | #78 | Exceptional 16.7% |
| Immigrants | Bulgaria | 99.3 /100 | #79 | Exceptional 16.7% |
| Egyptians | 99.2 /100 | #80 | Exceptional 16.7% |
| Immigrants | Netherlands | 99.2 /100 | #81 | Exceptional 16.7% |
| Swiss | 99.2 /100 | #82 | Exceptional 16.7% |
| Serbians | 99.1 /100 | #83 | Exceptional 16.7% |
| Belgians | 99.1 /100 | #84 | Exceptional 16.7% |
| Immigrants | Moldova | 99.1 /100 | #85 | Exceptional 16.7% |
| Immigrants | South Africa | 99.0 /100 | #86 | Exceptional 16.7% |
| Native Hawaiians | 99.0 /100 | #87 | Exceptional 16.7% |
| Immigrants | Philippines | 99.0 /100 | #88 | Exceptional 16.7% |
| Immigrants | Egypt | 98.8 /100 | #89 | Exceptional 16.7% |
| South Americans | 98.8 /100 | #90 | Exceptional 16.7% |
| Danes | 98.8 /100 | #91 | Exceptional 16.7% |
| Immigrants | South America | 98.8 /100 | #92 | Exceptional 16.7% |