Samoan vs Creek Cognitive Disability
COMPARE
Samoan
Creek
Cognitive Disability
Cognitive Disability Comparison
Samoans
Creek
17.9%
COGNITIVE DISABILITY
0.7/ 100
METRIC RATING
247th/ 347
METRIC RANK
18.3%
COGNITIVE DISABILITY
0.0/ 100
METRIC RATING
300th/ 347
METRIC RANK
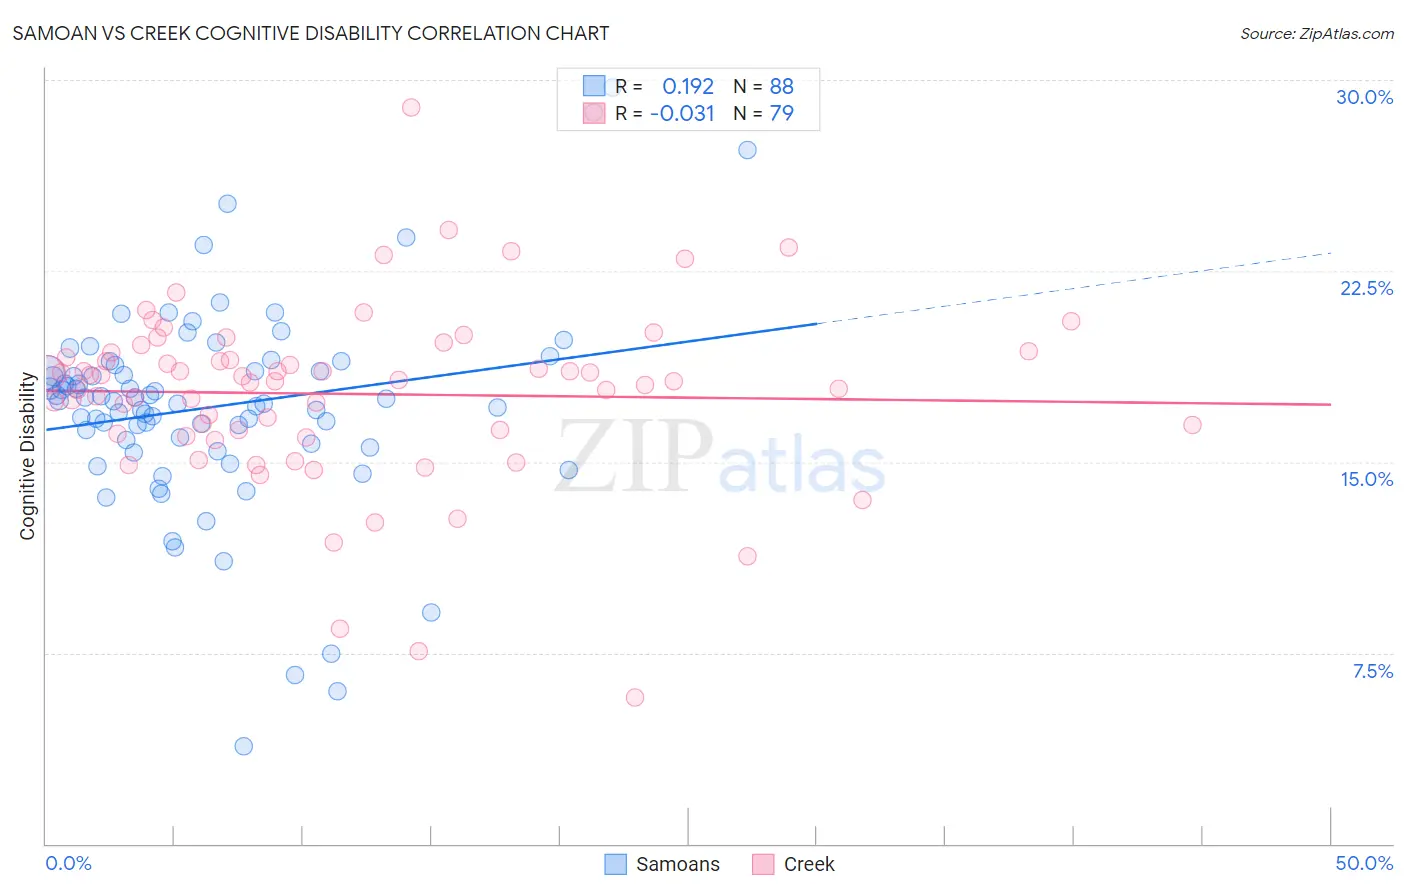
Samoan vs Creek Cognitive Disability Correlation Chart
The statistical analysis conducted on geographies consisting of 225,130,180 people shows a poor positive correlation between the proportion of Samoans and percentage of population with cognitive disability in the United States with a correlation coefficient (R) of 0.192 and weighted average of 17.9%. Similarly, the statistical analysis conducted on geographies consisting of 178,450,672 people shows no correlation between the proportion of Creek and percentage of population with cognitive disability in the United States with a correlation coefficient (R) of -0.031 and weighted average of 18.3%, a difference of 2.1%.
Cognitive Disability Correlation Summary
| Measurement | Samoan | Creek |
| Minimum | 3.8% | 5.7% |
| Maximum | 29.7% | 28.9% |
| Range | 25.9% | 23.2% |
| Mean | 17.2% | 17.7% |
| Median | 17.4% | 18.2% |
| Interquartile 25% (IQ1) | 15.8% | 16.1% |
| Interquartile 75% (IQ3) | 18.7% | 19.3% |
| Interquartile Range (IQR) | 2.9% | 3.2% |
| Standard Deviation (Sample) | 4.1% | 3.5% |
| Standard Deviation (Population) | 4.1% | 3.5% |
Similar Demographics by Cognitive Disability
Demographics Similar to Samoans by Cognitive Disability
In terms of cognitive disability, the demographic groups most similar to Samoans are French American Indian (17.9%, a difference of 0.010%), Cree (17.9%, a difference of 0.060%), Immigrants from Ethiopia (17.9%, a difference of 0.060%), Immigrants from Thailand (17.9%, a difference of 0.070%), and Malaysian (17.9%, a difference of 0.070%).
| Demographics | Rating | Rank | Cognitive Disability |
| Iraqis | 1.4 /100 | #240 | Tragic 17.8% |
| Mexicans | 1.1 /100 | #241 | Tragic 17.8% |
| Paiute | 1.1 /100 | #242 | Tragic 17.8% |
| Immigrants | Bangladesh | 1.0 /100 | #243 | Tragic 17.8% |
| Jamaicans | 0.9 /100 | #244 | Tragic 17.9% |
| Trinidadians and Tobagonians | 0.8 /100 | #245 | Tragic 17.9% |
| Immigrants | Thailand | 0.8 /100 | #246 | Tragic 17.9% |
| Samoans | 0.7 /100 | #247 | Tragic 17.9% |
| French American Indians | 0.7 /100 | #248 | Tragic 17.9% |
| Cree | 0.7 /100 | #249 | Tragic 17.9% |
| Immigrants | Ethiopia | 0.7 /100 | #250 | Tragic 17.9% |
| Malaysians | 0.6 /100 | #251 | Tragic 17.9% |
| Immigrants | Grenada | 0.6 /100 | #252 | Tragic 17.9% |
| Hopi | 0.6 /100 | #253 | Tragic 17.9% |
| Hispanics or Latinos | 0.6 /100 | #254 | Tragic 17.9% |
Demographics Similar to Creek by Cognitive Disability
In terms of cognitive disability, the demographic groups most similar to Creek are Ghanaian (18.3%, a difference of 0.020%), Blackfeet (18.3%, a difference of 0.060%), Japanese (18.3%, a difference of 0.060%), Immigrants from Ghana (18.3%, a difference of 0.14%), and Immigrants from Burma/Myanmar (18.2%, a difference of 0.20%).
| Demographics | Rating | Rank | Cognitive Disability |
| Central American Indians | 0.1 /100 | #293 | Tragic 18.2% |
| British West Indians | 0.1 /100 | #294 | Tragic 18.2% |
| German Russians | 0.0 /100 | #295 | Tragic 18.2% |
| Immigrants | Burma/Myanmar | 0.0 /100 | #296 | Tragic 18.2% |
| Blackfeet | 0.0 /100 | #297 | Tragic 18.3% |
| Japanese | 0.0 /100 | #298 | Tragic 18.3% |
| Ghanaians | 0.0 /100 | #299 | Tragic 18.3% |
| Creek | 0.0 /100 | #300 | Tragic 18.3% |
| Immigrants | Ghana | 0.0 /100 | #301 | Tragic 18.3% |
| Barbadians | 0.0 /100 | #302 | Tragic 18.3% |
| Immigrants | Kenya | 0.0 /100 | #303 | Tragic 18.3% |
| Immigrants | Eritrea | 0.0 /100 | #304 | Tragic 18.3% |
| Colville | 0.0 /100 | #305 | Tragic 18.3% |
| Seminole | 0.0 /100 | #306 | Tragic 18.3% |
| Ugandans | 0.0 /100 | #307 | Tragic 18.3% |