Spaniard vs Immigrants from South America Vision Disability
COMPARE
Spaniard
Immigrants from South America
Vision Disability
Vision Disability Comparison
Spaniards
Immigrants from South America
2.4%
VISION DISABILITY
0.1/ 100
METRIC RATING
272nd/ 347
METRIC RANK
2.1%
VISION DISABILITY
73.8/ 100
METRIC RATING
153rd/ 347
METRIC RANK
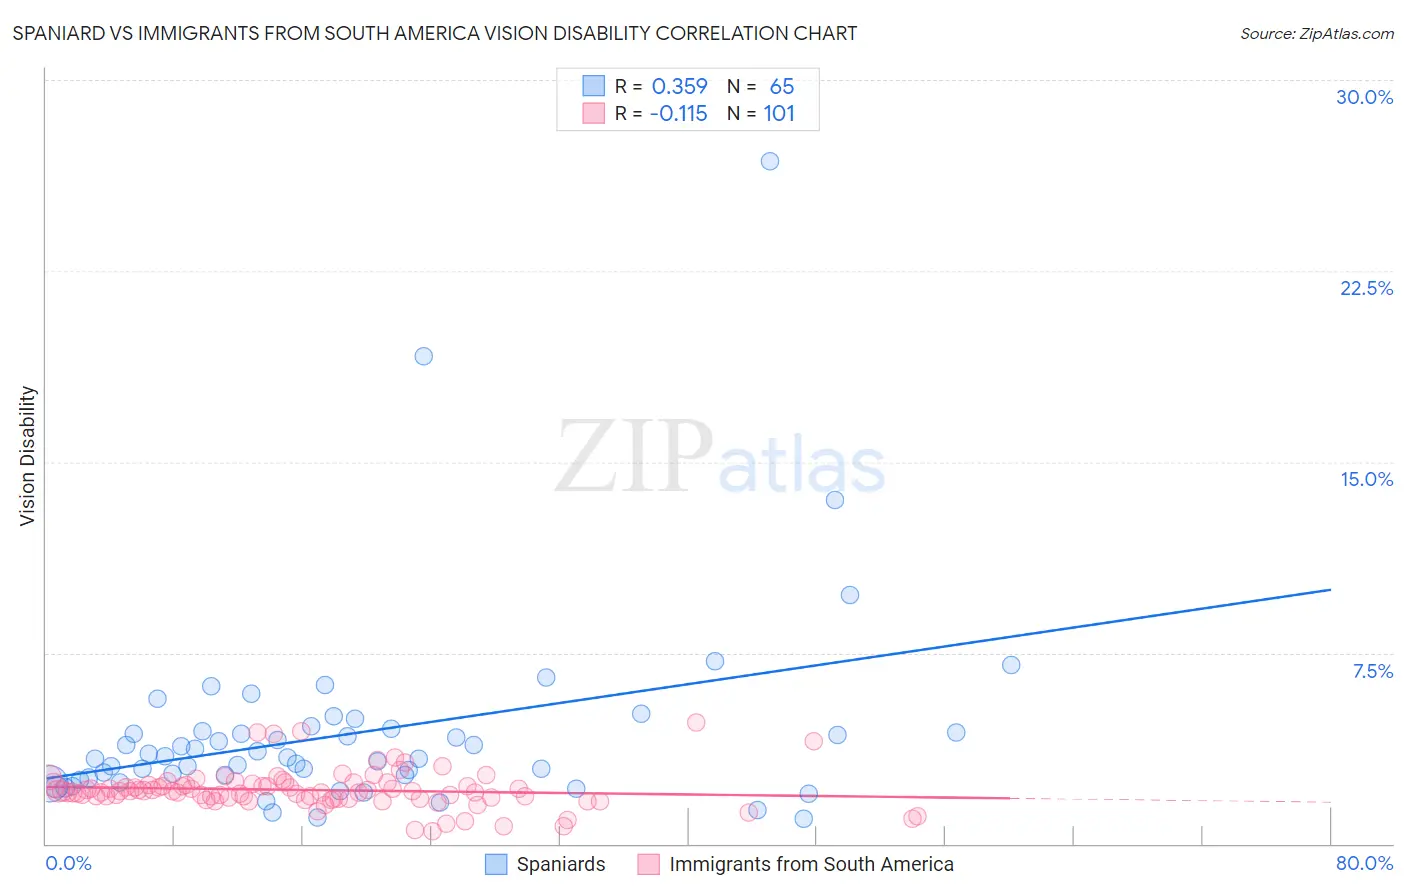
Spaniard vs Immigrants from South America Vision Disability Correlation Chart
The statistical analysis conducted on geographies consisting of 443,022,982 people shows a mild positive correlation between the proportion of Spaniards and percentage of population with vision disability in the United States with a correlation coefficient (R) of 0.359 and weighted average of 2.4%. Similarly, the statistical analysis conducted on geographies consisting of 485,713,263 people shows a poor negative correlation between the proportion of Immigrants from South America and percentage of population with vision disability in the United States with a correlation coefficient (R) of -0.115 and weighted average of 2.1%, a difference of 13.3%.
Vision Disability Correlation Summary
| Measurement | Spaniard | Immigrants from South America |
| Minimum | 0.97% | 0.49% |
| Maximum | 26.8% | 4.8% |
| Range | 25.9% | 4.3% |
| Mean | 4.4% | 2.1% |
| Median | 3.4% | 2.0% |
| Interquartile 25% (IQ1) | 2.5% | 1.8% |
| Interquartile 75% (IQ3) | 4.4% | 2.3% |
| Interquartile Range (IQR) | 1.9% | 0.53% |
| Standard Deviation (Sample) | 4.0% | 0.75% |
| Standard Deviation (Population) | 3.9% | 0.74% |
Similar Demographics by Vision Disability
Demographics Similar to Spaniards by Vision Disability
In terms of vision disability, the demographic groups most similar to Spaniards are Immigrants from the Azores (2.4%, a difference of 0.10%), Cuban (2.4%, a difference of 0.26%), Celtic (2.4%, a difference of 0.27%), Immigrants from Bahamas (2.4%, a difference of 0.33%), and Senegalese (2.4%, a difference of 0.54%).
| Demographics | Rating | Rank | Vision Disability |
| Immigrants | Jamaica | 0.1 /100 | #265 | Tragic 2.4% |
| Mexican American Indians | 0.1 /100 | #266 | Tragic 2.4% |
| Ute | 0.1 /100 | #267 | Tragic 2.4% |
| Senegalese | 0.1 /100 | #268 | Tragic 2.4% |
| Celtics | 0.1 /100 | #269 | Tragic 2.4% |
| Cubans | 0.1 /100 | #270 | Tragic 2.4% |
| Immigrants | Azores | 0.1 /100 | #271 | Tragic 2.4% |
| Spaniards | 0.1 /100 | #272 | Tragic 2.4% |
| Immigrants | Bahamas | 0.1 /100 | #273 | Tragic 2.4% |
| Immigrants | Latin America | 0.0 /100 | #274 | Tragic 2.4% |
| Chippewa | 0.0 /100 | #275 | Tragic 2.4% |
| Scotch-Irish | 0.0 /100 | #276 | Tragic 2.4% |
| Bahamians | 0.0 /100 | #277 | Tragic 2.4% |
| Spanish | 0.0 /100 | #278 | Tragic 2.4% |
| Nepalese | 0.0 /100 | #279 | Tragic 2.4% |
Demographics Similar to Immigrants from South America by Vision Disability
In terms of vision disability, the demographic groups most similar to Immigrants from South America are Slovene (2.1%, a difference of 0.010%), Immigrants from Southern Europe (2.1%, a difference of 0.070%), Immigrants from Colombia (2.1%, a difference of 0.14%), Immigrants from Norway (2.1%, a difference of 0.15%), and Pakistani (2.1%, a difference of 0.17%).
| Demographics | Rating | Rank | Vision Disability |
| Italians | 79.7 /100 | #146 | Good 2.1% |
| Immigrants | Sudan | 78.4 /100 | #147 | Good 2.1% |
| Finns | 78.3 /100 | #148 | Good 2.1% |
| Colombians | 76.2 /100 | #149 | Good 2.1% |
| Belgians | 75.9 /100 | #150 | Good 2.1% |
| Immigrants | Norway | 75.5 /100 | #151 | Good 2.1% |
| Immigrants | Southern Europe | 74.6 /100 | #152 | Good 2.1% |
| Immigrants | South America | 73.8 /100 | #153 | Good 2.1% |
| Slovenes | 73.6 /100 | #154 | Good 2.1% |
| Immigrants | Colombia | 72.1 /100 | #155 | Good 2.1% |
| Pakistanis | 71.6 /100 | #156 | Good 2.1% |
| Serbians | 70.2 /100 | #157 | Good 2.1% |
| Immigrants | Uzbekistan | 69.9 /100 | #158 | Good 2.1% |
| South Africans | 69.8 /100 | #159 | Good 2.1% |
| Austrians | 69.0 /100 | #160 | Good 2.1% |