Spaniard vs Immigrants from Panama Professional Degree
COMPARE
Spaniard
Immigrants from Panama
Professional Degree
Professional Degree Comparison
Spaniards
Immigrants from Panama
4.4%
PROFESSIONAL DEGREE
52.0/ 100
METRIC RATING
172nd/ 347
METRIC RANK
4.1%
PROFESSIONAL DEGREE
12.3/ 100
METRIC RATING
209th/ 347
METRIC RANK
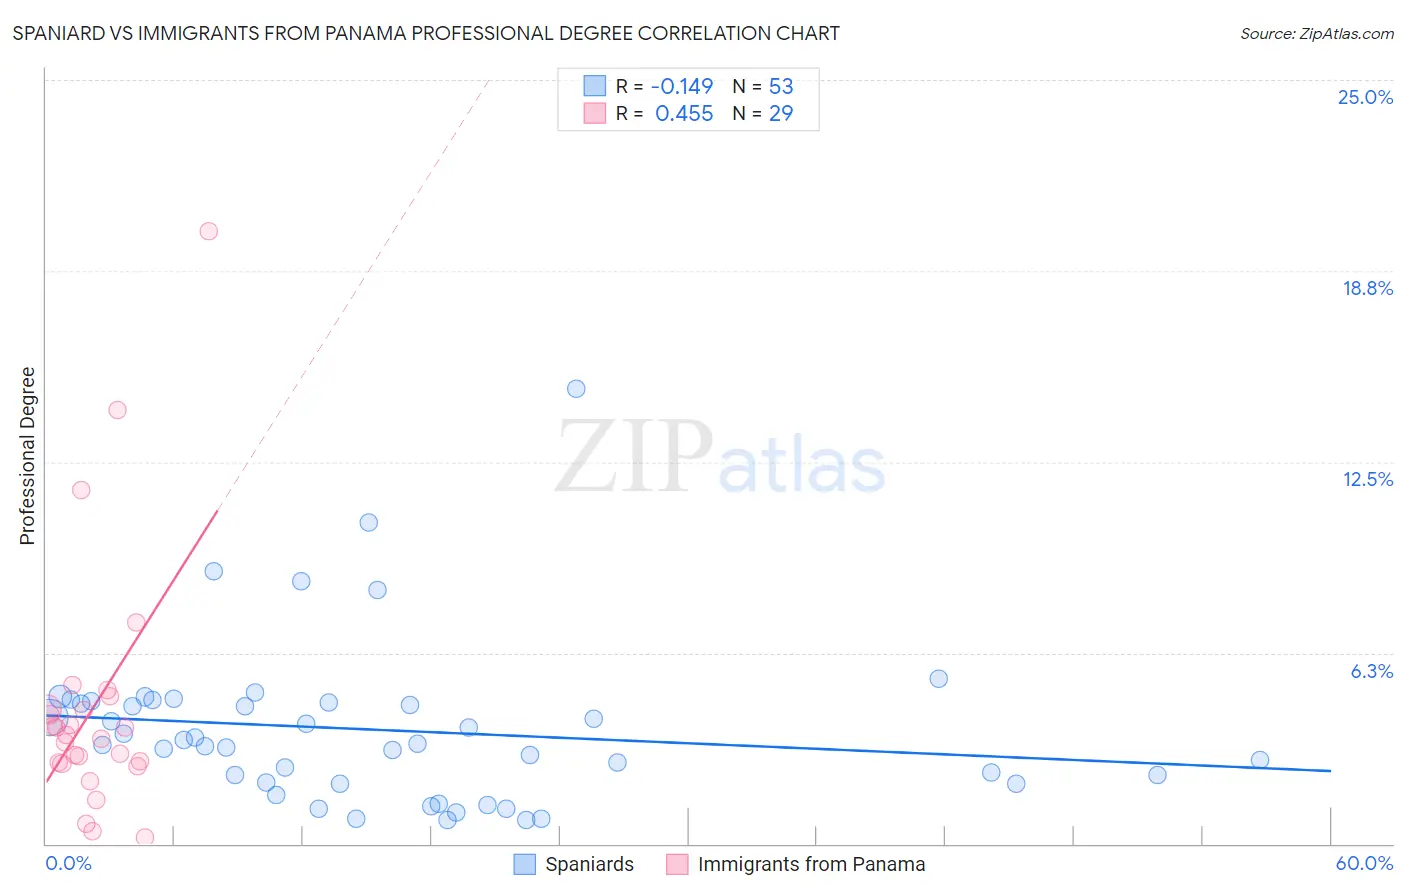
Spaniard vs Immigrants from Panama Professional Degree Correlation Chart
The statistical analysis conducted on geographies consisting of 441,720,376 people shows a poor negative correlation between the proportion of Spaniards and percentage of population with at least professional degree education in the United States with a correlation coefficient (R) of -0.149 and weighted average of 4.4%. Similarly, the statistical analysis conducted on geographies consisting of 221,001,104 people shows a moderate positive correlation between the proportion of Immigrants from Panama and percentage of population with at least professional degree education in the United States with a correlation coefficient (R) of 0.455 and weighted average of 4.1%, a difference of 8.0%.
Professional Degree Correlation Summary
| Measurement | Spaniard | Immigrants from Panama |
| Minimum | 0.77% | 0.20% |
| Maximum | 14.9% | 20.0% |
| Range | 14.1% | 19.9% |
| Mean | 3.7% | 4.5% |
| Median | 3.3% | 3.6% |
| Interquartile 25% (IQ1) | 2.0% | 2.6% |
| Interquartile 75% (IQ3) | 4.7% | 4.6% |
| Interquartile Range (IQR) | 2.7% | 2.0% |
| Standard Deviation (Sample) | 2.6% | 4.2% |
| Standard Deviation (Population) | 2.6% | 4.1% |
Similar Demographics by Professional Degree
Demographics Similar to Spaniards by Professional Degree
In terms of professional degree, the demographic groups most similar to Spaniards are English (4.4%, a difference of 0.28%), Kenyan (4.4%, a difference of 0.29%), Irish (4.4%, a difference of 0.30%), Immigrants from Peru (4.4%, a difference of 0.39%), and Immigrants from Bangladesh (4.4%, a difference of 0.57%).
| Demographics | Rating | Rank | Professional Degree |
| Costa Ricans | 59.9 /100 | #165 | Average 4.5% |
| Immigrants | Colombia | 59.4 /100 | #166 | Average 4.5% |
| Immigrants | Afghanistan | 59.2 /100 | #167 | Average 4.5% |
| Immigrants | Sierra Leone | 58.7 /100 | #168 | Average 4.5% |
| Chinese | 58.6 /100 | #169 | Average 4.5% |
| Immigrants | Zaire | 57.4 /100 | #170 | Average 4.5% |
| Immigrants | Bangladesh | 56.0 /100 | #171 | Average 4.4% |
| Spaniards | 52.0 /100 | #172 | Average 4.4% |
| English | 50.1 /100 | #173 | Average 4.4% |
| Kenyans | 50.0 /100 | #174 | Average 4.4% |
| Irish | 50.0 /100 | #175 | Average 4.4% |
| Immigrants | Peru | 49.3 /100 | #176 | Average 4.4% |
| Celtics | 47.6 /100 | #177 | Average 4.4% |
| Immigrants | Costa Rica | 46.7 /100 | #178 | Average 4.4% |
| Immigrants | Kenya | 45.9 /100 | #179 | Average 4.4% |
Demographics Similar to Immigrants from Panama by Professional Degree
In terms of professional degree, the demographic groups most similar to Immigrants from Panama are Immigrants from Somalia (4.1%, a difference of 0.080%), Subsaharan African (4.1%, a difference of 0.16%), Immigrants from Nigeria (4.1%, a difference of 0.22%), German (4.1%, a difference of 0.26%), and Yugoslavian (4.1%, a difference of 0.40%).
| Demographics | Rating | Rank | Professional Degree |
| Immigrants | Iraq | 17.1 /100 | #202 | Poor 4.2% |
| Panamanians | 15.9 /100 | #203 | Poor 4.1% |
| Barbadians | 15.8 /100 | #204 | Poor 4.1% |
| Somalis | 14.8 /100 | #205 | Poor 4.1% |
| Yugoslavians | 13.4 /100 | #206 | Poor 4.1% |
| Sub-Saharan Africans | 12.8 /100 | #207 | Poor 4.1% |
| Immigrants | Somalia | 12.5 /100 | #208 | Poor 4.1% |
| Immigrants | Panama | 12.3 /100 | #209 | Poor 4.1% |
| Immigrants | Nigeria | 11.7 /100 | #210 | Poor 4.1% |
| Germans | 11.6 /100 | #211 | Poor 4.1% |
| Whites/Caucasians | 11.2 /100 | #212 | Poor 4.1% |
| Koreans | 10.7 /100 | #213 | Poor 4.1% |
| Immigrants | Ghana | 10.6 /100 | #214 | Poor 4.1% |
| Portuguese | 10.5 /100 | #215 | Poor 4.1% |
| West Indians | 9.8 /100 | #216 | Tragic 4.1% |