Spaniard vs Immigrants from Sweden Ambulatory Disability
COMPARE
Spaniard
Immigrants from Sweden
Ambulatory Disability
Ambulatory Disability Comparison
Spaniards
Immigrants from Sweden
6.5%
AMBULATORY DISABILITY
1.6/ 100
METRIC RATING
242nd/ 347
METRIC RANK
5.6%
AMBULATORY DISABILITY
99.9/ 100
METRIC RATING
45th/ 347
METRIC RANK
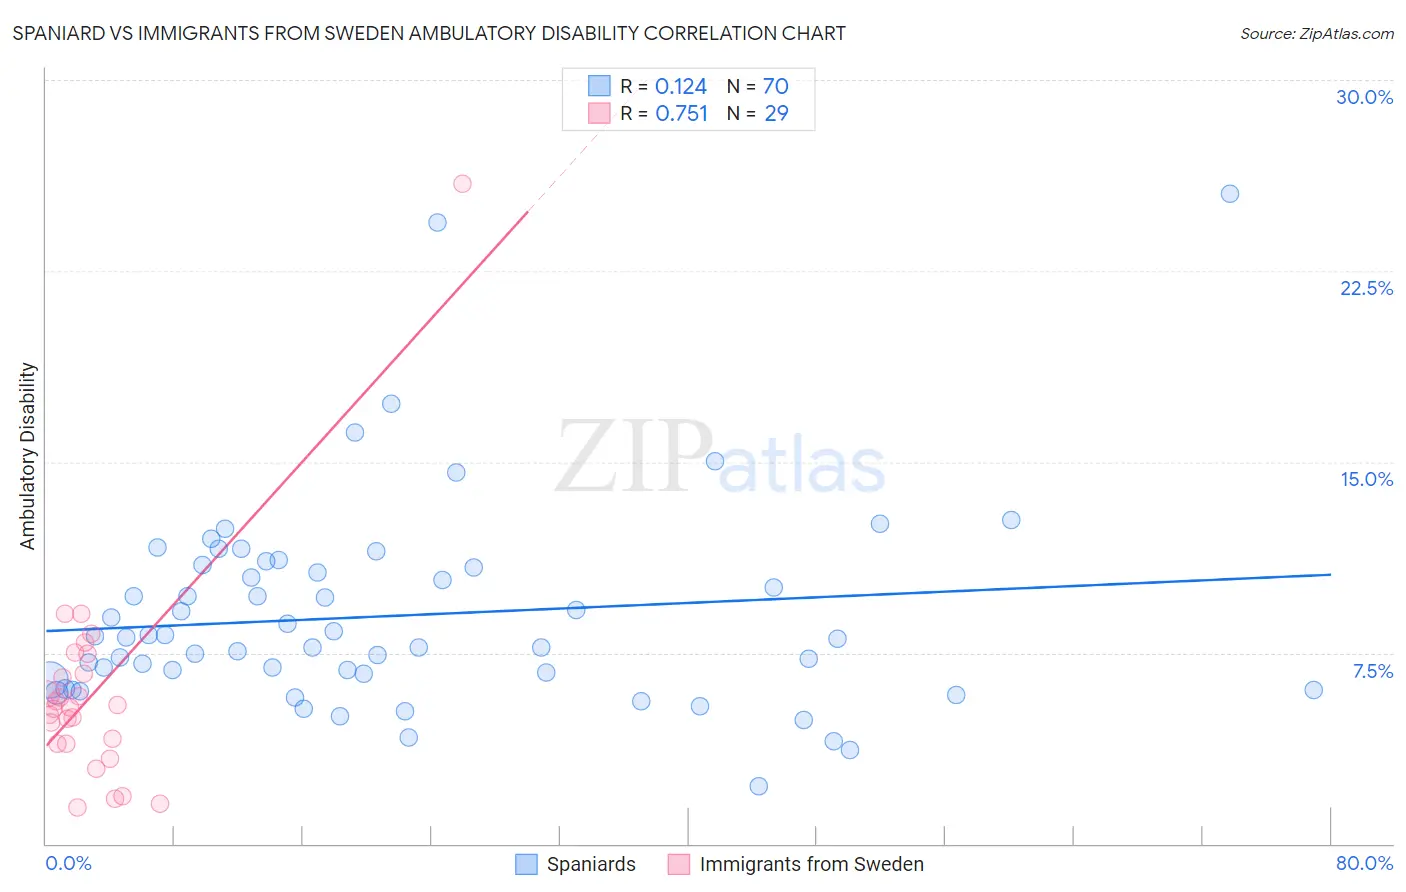
Spaniard vs Immigrants from Sweden Ambulatory Disability Correlation Chart
The statistical analysis conducted on geographies consisting of 443,300,484 people shows a poor positive correlation between the proportion of Spaniards and percentage of population with ambulatory disability in the United States with a correlation coefficient (R) of 0.124 and weighted average of 6.5%. Similarly, the statistical analysis conducted on geographies consisting of 164,722,765 people shows a strong positive correlation between the proportion of Immigrants from Sweden and percentage of population with ambulatory disability in the United States with a correlation coefficient (R) of 0.751 and weighted average of 5.6%, a difference of 16.2%.
Ambulatory Disability Correlation Summary
| Measurement | Spaniard | Immigrants from Sweden |
| Minimum | 2.3% | 1.4% |
| Maximum | 25.6% | 25.9% |
| Range | 23.3% | 24.5% |
| Mean | 9.0% | 5.9% |
| Median | 8.1% | 5.4% |
| Interquartile 25% (IQ1) | 6.4% | 3.9% |
| Interquartile 75% (IQ3) | 10.9% | 7.1% |
| Interquartile Range (IQR) | 4.4% | 3.1% |
| Standard Deviation (Sample) | 4.1% | 4.4% |
| Standard Deviation (Population) | 4.0% | 4.3% |
Similar Demographics by Ambulatory Disability
Demographics Similar to Spaniards by Ambulatory Disability
In terms of ambulatory disability, the demographic groups most similar to Spaniards are German (6.5%, a difference of 0.020%), Immigrants from Panama (6.5%, a difference of 0.020%), Immigrants from Haiti (6.5%, a difference of 0.030%), Tlingit-Haida (6.5%, a difference of 0.060%), and Armenian (6.5%, a difference of 0.070%).
| Demographics | Rating | Rank | Ambulatory Disability |
| Hispanics or Latinos | 2.2 /100 | #235 | Tragic 6.4% |
| Dutch | 2.0 /100 | #236 | Tragic 6.4% |
| Immigrants | Germany | 1.8 /100 | #237 | Tragic 6.4% |
| Haitians | 1.8 /100 | #238 | Tragic 6.4% |
| Senegalese | 1.7 /100 | #239 | Tragic 6.4% |
| Immigrants | Senegal | 1.7 /100 | #240 | Tragic 6.4% |
| Immigrants | Haiti | 1.6 /100 | #241 | Tragic 6.5% |
| Spaniards | 1.6 /100 | #242 | Tragic 6.5% |
| Germans | 1.5 /100 | #243 | Tragic 6.5% |
| Immigrants | Panama | 1.5 /100 | #244 | Tragic 6.5% |
| Tlingit-Haida | 1.5 /100 | #245 | Tragic 6.5% |
| Armenians | 1.5 /100 | #246 | Tragic 6.5% |
| Immigrants | Cuba | 1.4 /100 | #247 | Tragic 6.5% |
| Immigrants | Portugal | 1.4 /100 | #248 | Tragic 6.5% |
| Native Hawaiians | 1.1 /100 | #249 | Tragic 6.5% |
Demographics Similar to Immigrants from Sweden by Ambulatory Disability
In terms of ambulatory disability, the demographic groups most similar to Immigrants from Sweden are Egyptian (5.6%, a difference of 0.010%), Immigrants from Japan (5.6%, a difference of 0.010%), Immigrants from Argentina (5.6%, a difference of 0.020%), Immigrants from Indonesia (5.5%, a difference of 0.17%), and Bulgarian (5.6%, a difference of 0.22%).
| Demographics | Rating | Rank | Ambulatory Disability |
| Cypriots | 100.0 /100 | #38 | Exceptional 5.5% |
| Immigrants | Eritrea | 100.0 /100 | #39 | Exceptional 5.5% |
| Venezuelans | 99.9 /100 | #40 | Exceptional 5.5% |
| Mongolians | 99.9 /100 | #41 | Exceptional 5.5% |
| Argentineans | 99.9 /100 | #42 | Exceptional 5.5% |
| Paraguayans | 99.9 /100 | #43 | Exceptional 5.5% |
| Immigrants | Indonesia | 99.9 /100 | #44 | Exceptional 5.5% |
| Immigrants | Sweden | 99.9 /100 | #45 | Exceptional 5.6% |
| Egyptians | 99.9 /100 | #46 | Exceptional 5.6% |
| Immigrants | Japan | 99.9 /100 | #47 | Exceptional 5.6% |
| Immigrants | Argentina | 99.9 /100 | #48 | Exceptional 5.6% |
| Bulgarians | 99.9 /100 | #49 | Exceptional 5.6% |
| Luxembourgers | 99.9 /100 | #50 | Exceptional 5.6% |
| Taiwanese | 99.8 /100 | #51 | Exceptional 5.6% |
| Jordanians | 99.8 /100 | #52 | Exceptional 5.6% |