Spaniard vs Liberian Ambulatory Disability
COMPARE
Spaniard
Liberian
Ambulatory Disability
Ambulatory Disability Comparison
Spaniards
Liberians
6.5%
AMBULATORY DISABILITY
1.6/ 100
METRIC RATING
242nd/ 347
METRIC RANK
6.3%
AMBULATORY DISABILITY
7.1/ 100
METRIC RATING
224th/ 347
METRIC RANK
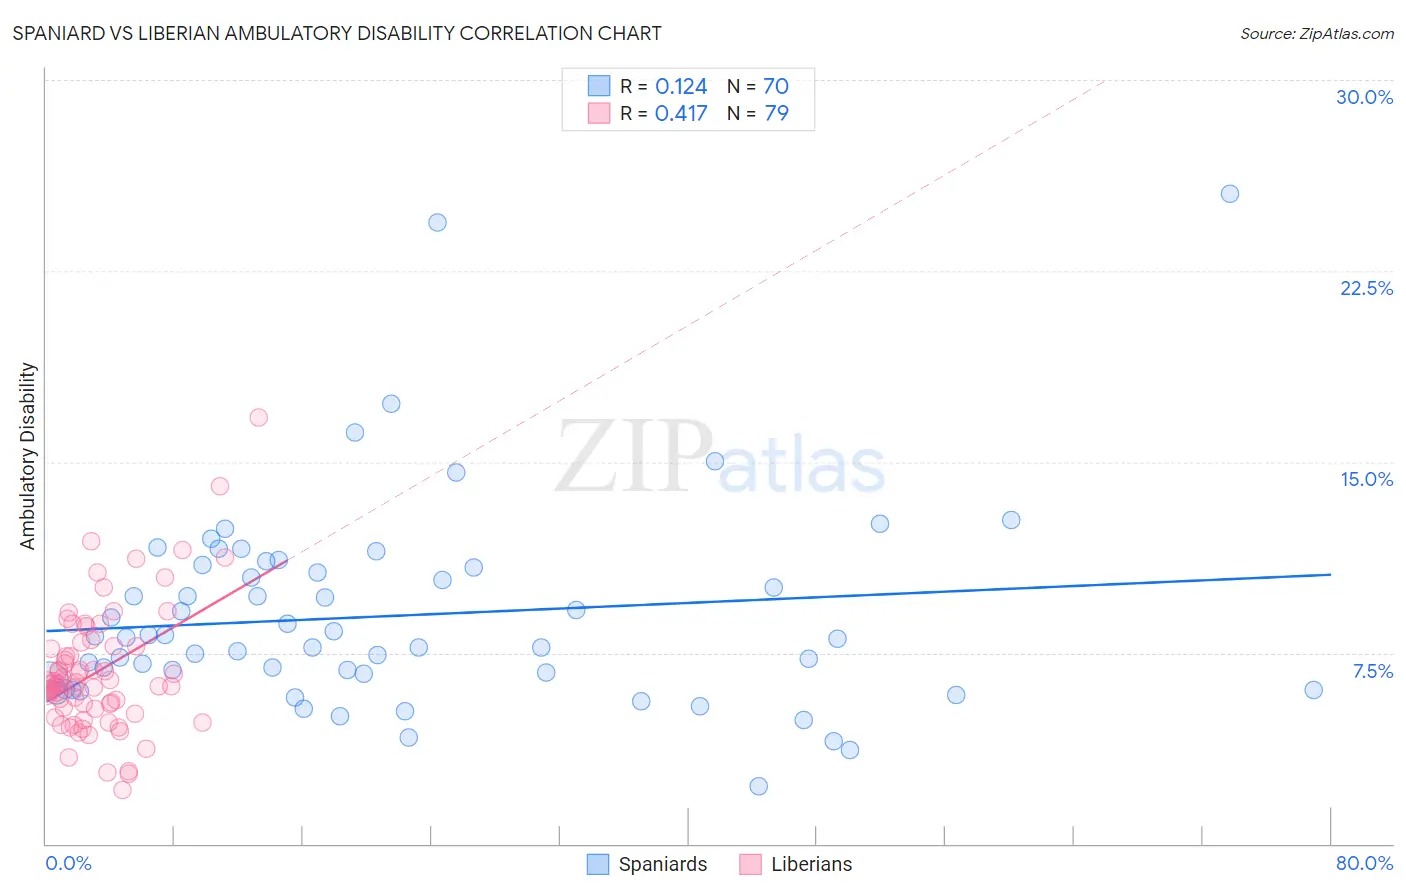
Spaniard vs Liberian Ambulatory Disability Correlation Chart
The statistical analysis conducted on geographies consisting of 443,300,484 people shows a poor positive correlation between the proportion of Spaniards and percentage of population with ambulatory disability in the United States with a correlation coefficient (R) of 0.124 and weighted average of 6.5%. Similarly, the statistical analysis conducted on geographies consisting of 118,077,126 people shows a moderate positive correlation between the proportion of Liberians and percentage of population with ambulatory disability in the United States with a correlation coefficient (R) of 0.417 and weighted average of 6.3%, a difference of 2.0%.
Ambulatory Disability Correlation Summary
| Measurement | Spaniard | Liberian |
| Minimum | 2.3% | 2.1% |
| Maximum | 25.6% | 16.8% |
| Range | 23.3% | 14.6% |
| Mean | 9.0% | 6.8% |
| Median | 8.1% | 6.3% |
| Interquartile 25% (IQ1) | 6.4% | 5.3% |
| Interquartile 75% (IQ3) | 10.9% | 7.8% |
| Interquartile Range (IQR) | 4.4% | 2.5% |
| Standard Deviation (Sample) | 4.1% | 2.5% |
| Standard Deviation (Population) | 4.0% | 2.5% |
Demographics Similar to Spaniards and Liberians by Ambulatory Disability
In terms of ambulatory disability, the demographic groups most similar to Spaniards are German (6.5%, a difference of 0.020%), Immigrants from Haiti (6.5%, a difference of 0.030%), Immigrants from Senegal (6.4%, a difference of 0.11%), Senegalese (6.4%, a difference of 0.14%), and Haitian (6.4%, a difference of 0.21%). Similarly, the demographic groups most similar to Liberians are Immigrants from Honduras (6.3%, a difference of 0.10%), Honduran (6.3%, a difference of 0.17%), Slavic (6.4%, a difference of 0.44%), Cuban (6.4%, a difference of 0.77%), and Portuguese (6.4%, a difference of 0.79%).
| Demographics | Rating | Rank | Ambulatory Disability |
| Immigrants | Honduras | 7.6 /100 | #223 | Tragic 6.3% |
| Liberians | 7.1 /100 | #224 | Tragic 6.3% |
| Hondurans | 6.3 /100 | #225 | Tragic 6.3% |
| Slavs | 5.1 /100 | #226 | Tragic 6.4% |
| Cubans | 4.0 /100 | #227 | Tragic 6.4% |
| Portuguese | 4.0 /100 | #228 | Tragic 6.4% |
| Czechoslovakians | 3.8 /100 | #229 | Tragic 6.4% |
| Mexicans | 3.5 /100 | #230 | Tragic 6.4% |
| Panamanians | 3.1 /100 | #231 | Tragic 6.4% |
| Assyrians/Chaldeans/Syriacs | 2.4 /100 | #232 | Tragic 6.4% |
| Sub-Saharan Africans | 2.3 /100 | #233 | Tragic 6.4% |
| Immigrants | Liberia | 2.3 /100 | #234 | Tragic 6.4% |
| Hispanics or Latinos | 2.2 /100 | #235 | Tragic 6.4% |
| Dutch | 2.0 /100 | #236 | Tragic 6.4% |
| Immigrants | Germany | 1.8 /100 | #237 | Tragic 6.4% |
| Haitians | 1.8 /100 | #238 | Tragic 6.4% |
| Senegalese | 1.7 /100 | #239 | Tragic 6.4% |
| Immigrants | Senegal | 1.7 /100 | #240 | Tragic 6.4% |
| Immigrants | Haiti | 1.6 /100 | #241 | Tragic 6.5% |
| Spaniards | 1.6 /100 | #242 | Tragic 6.5% |
| Germans | 1.5 /100 | #243 | Tragic 6.5% |